New Perspectives Excel 365/2021 | Module 10: SAM Project 1b | Corvallis Group Restore (Update 2025)
New Perspectives Excel 365/2021 | Module 10: SAM Project 1b
Corvallis Group Restore
ANALYZE DATA WITH POWER TOOLS
GETTING STARTED
• Save the file NP_EX365_2021_10b_Mac_FirstLastName_1.xlsx as NP_EX365_2021_10b_Mac_FirstLastName_2.xlsx
o Edit the file name by changing “1” to “2”.
o If you do not see the .xlsx file extension, do not type it. The file extension will be added for you automatically.
• To complete this Project, you will also need the following files:
o Support_EX365_2021_10b_Mac_History.csv
o Support_EX365_2021_10b_Mac_Restore.txt
• With the file NP_EX365_2021_10b_Mac_FirstLastName_2.xlsx open, ensure that your first and last name is displayed in cell B6 of the Documentation worksheet.
o If cell B6 does not display your name, delete the file and download a new copy.
PROJECT STEPS
1. Lucia Campos and three friends own a small business called Corvallis Group Restore, an upcycling business in Corvallis, Oregon, that sells useful and attractive products made from old or discarded materials. Lucia asks for your help in producing a sales report. She wants to analyze sales for the past year and project future sales. To create the report, you need to import data from various sources and use the Excel Power tools.
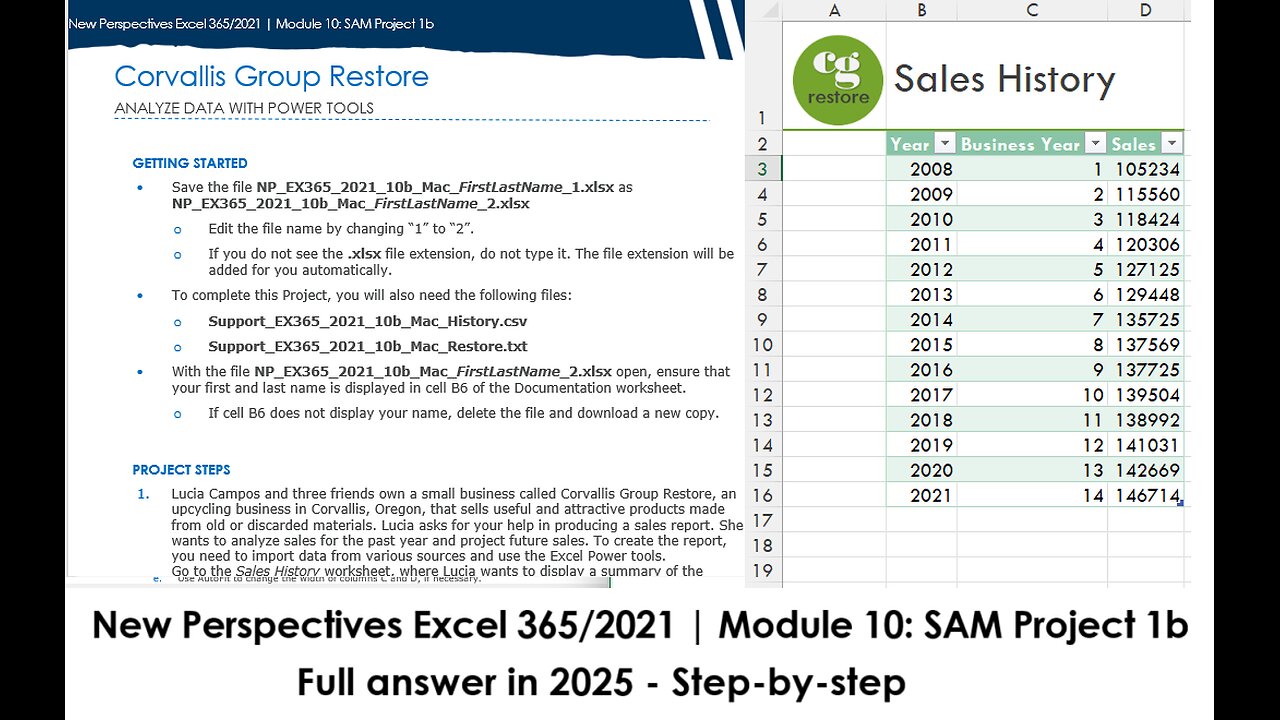
Go to the Sales History worksheet, where Lucia wants to display a summary of the company's annual sales since the business started in the year 2011. She has a text file that already contains this data. Import the data from a CSV file into a new table as follows:
a. Import data from the Support_EX365_2021_10b_Mac_History.csv text file.
b. Start loading the data at row 1, and separate the columns using comma delimiters.
c. Only edit the data to skip the Items Sold and Notes columns, and load the query data to a table in cell B2 of the existing worksheet.
d. Format the imported data as a table with headers using the Table Style Medium 7 table style (Hint: If an alert comes up, press "Yes" to convert the range to a table. Depending on your version of Office, the table style may be written as Teal, Table Style Medium 7.)
e. Use AutoFit to change the width of columns C and D, if necessary.
2. The Monthly Sales worksheet lists the sales per month for the previous year in a table and compares the sales in a chart. Lucia previously imported this data, and she wants to track the changes in monthly sales and project the first six months of this year's sales. Go to the Sheet4 worksheet. Create a chart to track the changes and project a forecast as follows:
a. Rename the Sheet4 worksheet using Jan to June Forecast as the name of the new sheet.
b. Copy the formula from the range C14:E14 to the range C15:E20.
c. Based on the data in the range A1:E20, create a Line chart.
d. Remove the chart title from the line chart, and set the number of the vertical axis to Currency with 0 decimal places and $ as the symbol, if necessary.
e. Resize and move the chart so that the upper-left corner is within cell C2 and the lower-right corner is within cell E13.
3. Go to the Material worksheet. Lucia wants to display information about products sold according to location and material. She has been tracking this data in an Access database. Import the data as follows:
a. Import data from the Support_EX365_2021_10b_Mac_Restore.txt file to a new worksheet in the NP_EX365_2021_10b_Mac_FirstLastName_2.xlsx workbook.
b. Start loading the data at row 1, and separate the columns using tab delimiters.
c. Load the data to a new worksheet, using Product Data as the name of the new worksheet.
d. Format the imported data as a table with headers using the Table Style Medium 7 table style. (Hint: If an alert comes up, press "Yes" to convert the range to a table. Depending on your version of Office, the table style may be written as Teal, Table Style Medium 7.)
e. Rename the table using Products as the name.
Go back to the Material worksheet, Lucia wants to show the material of the products sold in each of the company's five locations during 2024.
f. In cell B2 of the Material worksheet, insert a PivotTable based on the data in the Products table.
4. Edit the PivotTable as follows to provide this information for Lucia:
a. Use the following fields from the Products table in the PivotTable:
· Material field for the row headings
· SiteCity field for the column headings
· ItemQty field for the values
b. Use Products Sold as the custom name of the Sum of ItemQty field.
c. In cell B3, use Product Material to replace "Row Labels", and then resize column B to its best fit.
d. In cell C2, use Locations to replace "Column Labels".
5. Lucia occasionally would like to focus on the number of products sold in the five locations per month.
Add a Timeline Slicer as follows to the Material worksheet:
a. Insert a Timeline Slicer that uses the OrderDate field from the Products table.
b. Move and resize the Timeline Slicer so that it covers the range B12:H19.
c. Clear the filter on the Timeline Slicer to display all periods, if necessary.
6. Lucia also wants to examine the percentage each type of product contributed to total sales in each location. Create a PivotChart as follows:
a. Based on the PivotTable on the Material worksheet, create a 100% Stacked Column PivotChart.
b. Move and resize the PivotChart so that its upper-left corner is in cell I2 and its lower-right corner is in cell N17.
7. Go to the Product Types worksheet. Lucia wants to compare products sold by category and vendor. This data is stored in the Sales and Products tables. Create a PivotTable as follows that provides the products sold by manufacturer information for Lucia:
a. In cell B2, insert a PivotTable in the Product Types worksheet based on the Products table you created.
b. Use the following fields in the PivotTable:
· Vendor field for the row headings
· Category field for the column headings
· ItemQty field for the values
8. Lucia asks for another way to visualize the products sold by vendor. Create a PivotChart as follows:
a. Based on the PivotTable on the Product Types worksheet, create a Stacked Bar PivotChart.
b. Move and resize the PivotChart so that its upper-left corner is within cell B24 and its lower-right corner is within cell I38.
9. Lucia also wants to be able to focus on a single category of product at a time.
Add a slicer to the PivotChart as follows:
a. Add a slicer based on the Category field from the Products table.
b. Move the slicer below the PivotChart so that it covers the range J24:L37.
c. Use the slicer to filter the PivotTable and PivotChart to show only products in the Housewares category.
Your workbook should look like the Final Figures on the following pages. Save your changes, close the workbook, and then exit Excel. Follow the directions on the website to submit your completed project.
Final Figure 1: Sales History Worksheet
Final Figure 2: Jan to June Forecast Worksheet
Final Figure 3: Monthly Sales Worksheet
Final Figure 4: Product Data Worksheet
Final Figure 5: Material Worksheet
Final Figure 6: Product Types Worksheet
-
 1:10:49
vivafrei
2 hours agoCNN Finallly Reports on Stabbing! GoFundMe Scam or Psy-Op? Trump E.J. Carroll Ruling & MORE
67K53 -
 LIVE
LIVE
Dr Disrespect
5 hours agoLIVE - DR DISRESPECT - MARVEL RIVALS, PUBG, OFF THE GRID - TRIPLE THREAT GAME CHALLENGE
1,553 watching -
 2:19:15
Tucker Carlson
4 hours agoBill Gates, Truth About Vaccines, & Big Pharma’s Plot to Destroy Doctors Who Question ”The Science”
91.8K89 -
 LIVE
LIVE
Film Threat
17 hours agoVERSUS: CONJURING BOX OFFICE HORROR | Film Threat Versus
117 watching -
 8:32
8:32
Millionaire Mentor
5 hours agoAdam Schiff LOSES IT After Trump’s AG EPICALLY Fires Back
4.8K8 -
 13:47
13:47
Rallied
1 hour ago $0.14 earnedSolo Challenges All Day
7.12K -
 1:11:16
The Quartering
3 hours agoBlack Fatigue Goes Nuclear, Baseball Karen Destroyed, Illegals At Hyundai & More!
77.8K71 -
 LIVE
LIVE
StoneMountain64
3 hours agoDelta Force Budget vs JUICER Loadouts
116 watching -
 LIVE
LIVE
Radiancevideography
8 hours ago $4.55 earnedAMHR Nationals 2025 (Day #5) Ford Arena 9/8/2025
425 watching -
 1:47:05
Russell Brand
5 hours agoEstablishment ATTACK RFK Jr As China Unveils Weapons AIMED at America’s Bases! - SF629
118K25