2 years agoWorld Government Summit Confirms Great Reset Is At Hand-What Will You Do?*WW3*Donbass*(S)-Elections*EEARTS
1 month agohow to draw pie chart with a descending order and showing only the top 8 portion in percentageTechSphere
1 month agoHow can I hide absolute numbers from the tooltip on a Pie Chart in Google Data StudioTechSphere
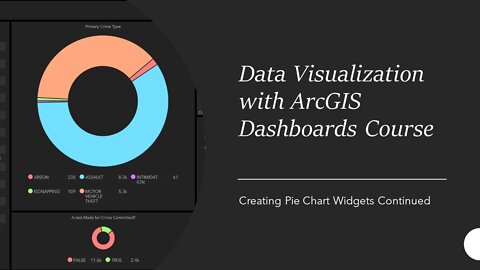
2 years ago04 - Creating First Pie Chart Widgets: ArcGIS Dashboards with Chicago Crime DataLearn with MJ
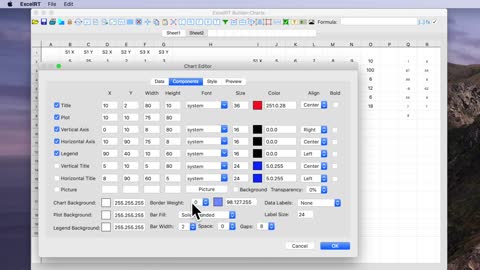
11 months ago"Pie Chart Perfection: Master the Art of Data Visualization with Step-by-Step Guidance!"NeroMath