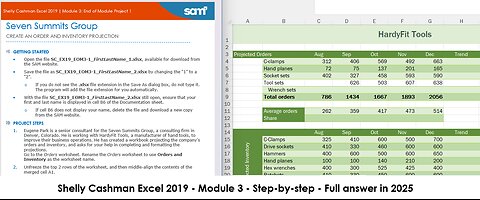
3 months agoShelly Cashman Excel 2019 | Module 3: End of Module Project 1 | Seven Summits Group (Update 2025)saxi753
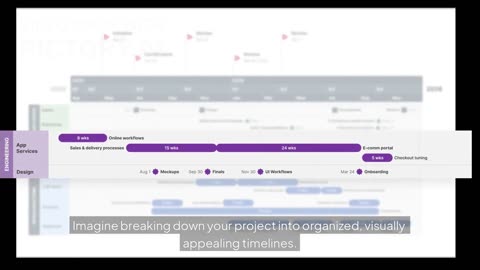
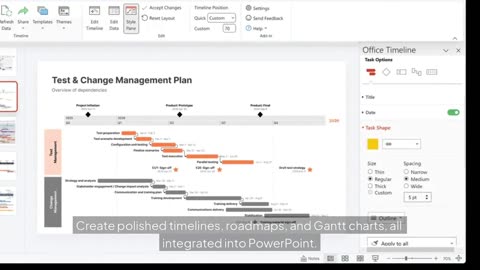
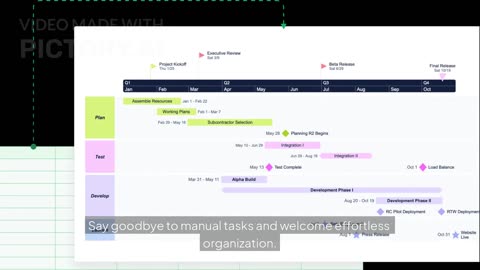
15 days agoBring Structure to Complex Projects | Master Planning with Office Timeline Sub-SwimlanesPixiNews
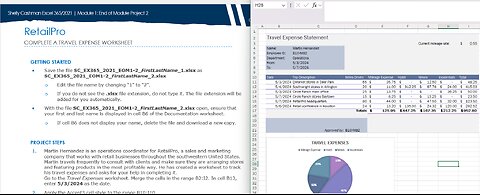
7 months agoShelly Cashman Excel 365/2021 (Update:2025) | Module 1: End of Module Project 2 | RetailProsaxi753
3 years agoWhat is the Gant chart? and how to Create a Gant in Excel? | advantages and disadvantages|Pixeled Apps
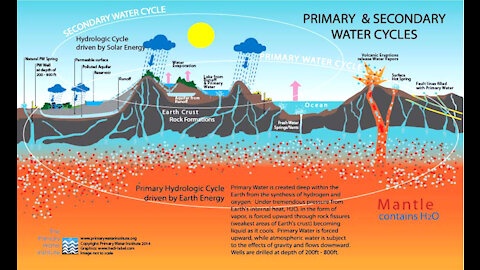
4 years agoSchumann Resonance Nov 16 2020 What the LIGHT Revealed, HOW TO FIND YOUR STRENGTHSusanInspired
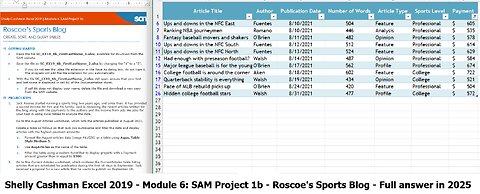
2 months agoShelly Cashman Excel 2019 | Module 6: SAM Project 1b | Roscoe’s Sports Blog (Full answer 2025)saxi753
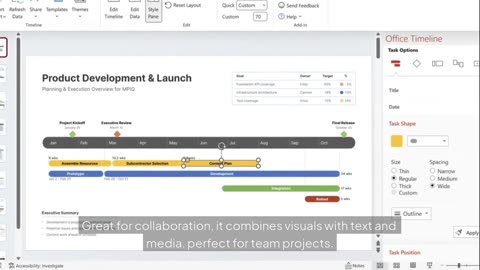
15 days agoTurn Raw Project Data into Stunning Visual Timelines | Office Timeline Import & SyncPixiNews