Description
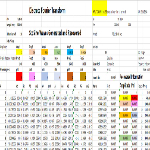
As an ecocnomic professor, I teach students every day about the various laws and theories and foundational concepts to help understand how economies function. In economics, several important formulas are used to quantify and analyze different concepts. These formulas help in understanding relationships between variables, predicting outcomes, and making more informed decisions. My interest in economics and its theories and principles led me to a study in the Fourier Transform Fourier Transform is a mathematical technique used to convert a function or signal from its original domain (often time or space) into a representation in the frequency domain. It helps break down a complex signal into its constituent sinusoidal components (sine and cosine waves), showing how much of each frequency is present in the original signal. As a avid stock trader, I wondered if the Fourier Transform could be used as a signal for trading stocks. What I discovered was that the Fourier Transform can be used in stock price prediction to analyze and identify underlying patterns in the data. This is true becuase the Fourier Transform is based on the principle that any periodic function can be represented as a sum of simple sine and cosine waves with different frequencies and amplitudes. By applying Fourier Transform to stock market data, I was able to decompose the data into its component frequencies and examine how they contribute to an overall pattern. The basics here is that it can help you to identify trends, cycles, and other patterns in the data that may not be apparent by simply looking at the raw stock prices. One common approach used by others who try to using Fourier Transform for stock price prediction is to decompose the data into different frequency bands and then use each band to make a separate prediction. For example, low-frequency components may be used to predict long-term trends, while high-frequency components may be used to predict short-term fluctuations. Fine....this is nothing new. What I discovered is a properieiary method, which I am calling SpectraTrade. SpectraTrade uses the frequency bands in a unique way to pick stocks that have a long-term upward potential. Also, SpectraTrade can also identify stocks to avoid that have, or more importantly, will have or will continue a long-term negative price momentum or underlying weakness. Take a look at my propiertiary spreadsheet I use daily for stock analysis. Fourier Transform is a complicated mathematical technique used to decompose a complex signal into its constituent frequencies, allowing us to analyze and understand the underlying patterns in various domains such as time or space. By transforming a signal into the frequency domain, it helps reveal hidden periodicities, trends, or noise, making it invaluable in fields like signal processing, audio engineering, image analysis, and even financial markets, where it can be used to detect cycles and trends in stock price movements. This spreadsheet is a currently a manual process where I have to input daily stock prices from various time frames. But I am hoping to raise enough capital to automate the process and create a stock scanner for my clients. But right now, I can only manage a few stocks at a time. For the next 6 to 12 months, my service will be free, allowing you to analyze and track my work. At the same time, I will be listing my predictions, for free, on my website at www.SpectraTrade.com Just a note here that everything I share or say is for learning purposes only and not investing advice. Talk to your broker or investment advisor before making any financial decisions. It's essential to conduct your own research and consider your individual financial situation, goals, and risk tolerance before engaging in any trading or investment activities. Always remember that past performance is not indicative of future results.
Additional Details
Joined Feb 28, 2023
14 views
1 video