


The key differences between working and non-working parents
The average working parent pulls an 18-hour workday when you factor in everything they do for their children, according to new research.
From getting everyone ready for the day and out the door, to managing a household, planning activities and trying to fit in some “me time,” parents have their work cut out for them.
The survey of 2,000 parents of kids ages 0-6 was evenly split between working and non-working parents and explored the key differences between both groups.
Along with their 9-5, working parents also spend two hours a day on household chores and another two hours transporting family members where they need to be.
They also spend an additional four hours preparing their child for the day or assisting with school work and other needs and one more hour on miscellaneous tasks and duties.
Working parents also admit they pull an average of two hours of overtime during the week, on top of about seven hours on their typical workday. This leaves only about six hours for sleep.
But this doesn’t mean that non-working parents don’t also have a full plate.
According to the results, those respondents still pull a 17-hour day.
Rather than dedicating hours to a workplace, these parents spend those nine hours looking after their children, an additional four hours on chores such as cooking or cleaning and two hours on both transportation and other outstanding duties.
Conducted by Talker Research on behalf of Kiddie Academy, the survey found that regardless of their employment status, almost all parents (96%) believe that being a parent means that they are always “on call.”
Overall, parents average only 31 minutes of “me time” per day and 15% even admit they never get that sacred time.
Yet almost three-quarters (73%) reported feeling confident upon entering parenthood.
Still, 56% of all parents admit that they feel guilty for not spending enough time with their child.
“With such a full plate, it’s no wonder that parents still feel that they don’t spend enough time with their child,” said Joy Turner, vice president of education at Kiddie Academy. “It’s important to make the most of the time you do spend together.”
With so much to do and so few hours in the day, the survey also explored how parents are working tirelessly to help their child excel in life and in school.
Results found that the average parent worries about their child’s growth and development four times each and every day.
The top skills all parents are trying to develop in their child include building good character (63%), social skills (62%), confidence (61%) and emotional regulation (56%).
Yet still, nearly a quarter struggle with teaching critical thinking skills (26%), how to create connections with others (25%) and building confidence (23%).
To try to help build their child’s confidence, most parents have allowed them to interact with others (64%), practiced positive affirmations with them (54%) or talked to their children about what they’re grateful for (47%).
Many parents even admit to going online and searching for ideas such as “latest games/toys to develop my child’s confidence” (30%) and “how do I build my child’s confidence?” (24%).
When asked where they feel they lack support, parents outlined things such as, “how to teach children correct habits,” “in terms of finding a good work-life balance” or even “Not spending enough time outside of the home.”
Some of the most anxiety-inducing milestone moments, according to parents, were sending their child to school for the first time (48%) and sending them to a daycare or childcare facility for the first time (32%).
Results found that 31% of parents polled currently use childcare — including 45% of working parents and 17% of non-working parents.
Of those respondents, 85% agree that utilizing childcare helps them maintain a sense of self and independence alongside being a parent.
The top benefits of childcare also include helping their child develop skills that are visible at home (48%), growing or developing faster or better (47%) as well as knowing that others besides themselves are teaching their child (37%).
For working parents, using childcare has also allowed them to be more productive at work (35%) has freed up their capacity (29%).
“It’s encouraging to see that many parents see the value and importance of educational child care to support both their children and their own well being,” said Turner. “The U.S. Surgeon General’s recent warning that parents are experiencing higher and more dire stress levels should be a reminder to parents to rely on your village - family, friends, and, if needed, a trusted child care provider. This can help improve stress levels and help children and parents flourish.”
Survey methodology:
Talker Research surveyed 1,000 non-working parents of children ages 0-6 and 1,000 full or part time working parents of children ages 0-6; the survey was commissioned by Kiddie Academy and administered and conducted online by Talker Research between August 18 to August 26, 2024.
We are sourcing from a non-probability frame and the two main sources we use are:
● Traditional online access panels — where respondents opt-in to take part in online market research for an incentive
● Programmatic — where respondents are online and are given the option to take part in a survey to receive a virtual incentive usually related to the online activity they are engaging in
Those who did not fit the specified sample were terminated from the survey. As the survey is fielded, dynamic online sampling is used, adjusting targeting to achieve the quotas specified as part of the sampling plan.
Regardless of which sources a respondent came from, they were directed to an Online Survey, where the survey was conducted in English; a link to the questionnaire can be shared upon request. Respondents were awarded points for completing the survey. These points have a small cash-equivalent monetary value.
Cells are only reported on for analysis if they have a minimum of 80 respondents, and statistical significance is calculated at the 95% level. Data is not weighted, but quotas and other parameters are put in place to reach the desired sample.
Interviews are excluded from the final analysis if they failed quality-checking measures. This includes:
● Speeders: Respondents who complete the survey in a time that is quicker than one-third of the median length of interview are disqualified as speeders
● Open ends: All verbatim responses (full open-ended questions as well as other please specify options) are checked for inappropriate or irrelevant text
● Bots: Captcha is enabled on surveys, which allows the research team to identify and disqualify bots
● Duplicates: Survey software has “deduping” based on digital fingerprinting, which ensures nobody is allowed to take the survey more than once
It is worth noting that this survey was only available to individuals with internet access, and the results may not be generalizable to those without internet access.
14
views
1
comment

After dramatic 'Bachelorette' finale, has reality TV gone too far?
Three in five Americans believe reality TV has gone too far, according to new research.
A new survey of 2,000 respondents examined people’s perceptions of reality TV with results showing many feel unscripted programs are taking too many liberties monetizing participants’ traumatic moments.
Respondents were asked whether they felt reality TV has taken participants’ personal hurt too far in entertainment—and a little more than half (57%) believe it has.
The survey, conducted by Talker Research, comes after the controversial Bachelorette season 21 finale in which star Jenn Tran was forced to re-watch her engagement breakup on live TV.
The episode saw fan backlash on social media with online conversations questioning the ethics surrounding the network’s decision to air the incident.
Results of the survey show half of Americans (56%) surveyed believe reality TV producers should be held accountable for the mental health of participants.
Half of millennials surveyed (46%) said they are reconsidering watching the Bachelor/Bachelorette franchise with 45% saying the Jenn Tran incident made them reflect on the reality TV they consume.
“Viewers are sympathetic to reality show participants,” said Dr. Carole Lieberman, a psychiatrist-consultant for reality TV. “But would they watch such shows if they were all warm and fuzzy as compared to the ones that put participants in the most humiliating situations?”
Lieberman said that in addition to viewers changing their minds on what they consider entertainment, other improvements should be made. “A good start would be to provide crisis aftercare for the participants in their home town, instead of quickly shoving them off the set and into cars taking them to the airport.”
When asked what additional policy changes Lieberman would like to see put in place to protect reality TV participants, she said, “Reality show contestant contracts basically say that the production company isn’t responsible for anything that goes wrong, anything the participant didn’t expect, or any damages to their reputation or to their life. But, it says this in veiled language, while holding out the promise of fame and fortune as a carrot.”
Lieberman went on to explain, “Reality shows should do more to evaluate the prospective participant’s mental health. Some shows have a psychiatrist-consultant, but the majority do not.”
Survey methodology:
Talker Research surveyed 2,000 general population Americans; administered and conducted online by Talker Research between September 6 and September 11, 2024.
We are sourcing from a non-probability frame and the two main sources we use are:
● Traditional online access panels — where respondents opt-in to take part in online market research for an incentive
● Programmatic — where respondents are online and are given the option to take part in a survey to receive a virtual incentive usually related to the online activity they are engaging in
Those who did not fit the specified sample were terminated from the survey. As the survey is fielded, dynamic online sampling is used, adjusting targeting to achieve the quotas specified as part of the sampling plan.
Regardless of which sources a respondent came from, they were directed to an Online Survey, where the survey was conducted in English; a link to the questionnaire can be shared upon request. Respondents were awarded points for completing the survey. These points have a small cash-equivalent monetary value.
Cells are only reported on for analysis if they have a minimum of 80 respondents, and statistical significance is calculated at the 95% level. Data is not weighted, but quotas and other parameters are put in place to reach the desired sample.
Interviews are excluded from the final analysis if they failed quality-checking measures. This includes:
● Speeders: Respondents who complete the survey in a time that is quicker than one-third of the median length of interview are disqualified as speeders
● Open ends: All verbatim responses (full open-ended questions as well as other please specify options) are checked for inappropriate or irrelevant text
● Bots: Captcha is enabled on surveys, which allows the research team to identify and disqualify bots
● Duplicates: Survey software has “deduping” based on digital fingerprinting, which ensures nobody is allowed to take the survey more than once
It is worth noting that this survey was only available to individuals with internet access, and the results may not be generalizable to those without internet access.
39
views
1
comment

Why prepping for a vacation feels like a job
Going on vacation is a job in itself, according to a new study.
A recent survey of 2,000 American homeowners found that the average person has at least six tasks on their to-do list to get ready for vacation.
And near the top of the list were items like doing last-minute shopping (70%), cleaning the house (54%), making sure friends and family have a key to the house in case of an emergency (50%), unplugging appliances (38%) and setting the lights on a timer (28%).
Conducted by Talker Research and commissioned by Schlage, the survey looked at homeowners' pre-vacation checklists to see which home safety measures are top of mind and which fall through the cracks before jetting off.
Respondents will generally check at least twice, on average, if they’ve locked the front door before embarking.
And needing extra peace of mind, vacationers will do two “last looks” around the house, on average, to make sure nothing has been forgotten and everything looks good before they depart.
Yet despite all this, nearly a quarter (22%) will typically turn the car around and go back home, before proceeding on the trip, because they forgot something or need to do one final “last look.”
One of the top reasons for these pre-trip delays was simply needing to re-check if they’ve actually locked the front door (40%).
Even still, nearly one in ten respondents (8%) have returned home post-vacation only to find that the door was unlocked.
However, security worries aren’t reserved for pre and post-vacation: They seep into homeowners’ travels too, according to the study.
Respondents reported it takes at least half a day (31%) — or even a full day for some (18%) — to fully relax, unwind and enjoy themselves on a trip.
According to the results, some of the top reasons for stress while on vacation included worrying about the state of things back at home (33%), missing a pet (30%) and mail and packages being stolen (19%).
Respondents estimated they spend 19 minutes, on average, texting neighbors to come check on things and rolling the tapes on security camera footage, while 13% will spend over an hour doing so.
“A secure home means a worry-free vacation,” said Tim Eskew, director of product management for Allegion, maker of Schlage Locks. “With advanced security technologies, you can enjoy peace of mind by remotely monitoring your home’s status and receiving real-time notifications of any activity. This enhanced visibility lets you fully immerse yourself in your travels, knowing your home is well-protected.”
Of the homeowners polled, the majority (65%) have at least one person visit their home while they’re away, whether that’s a house sitter or neighbor checking on the home.
And the going rate for a house sitter or someone who checks on the house is $28 per day, on average, according to respondents.
But regardless of whether homeowners hire a sitter, ask friends or family to come over, or neither, more than one in ten (14%) have come home from vacation to an unhappy surprise.
Common disasters respondents found when arriving home were theft or burglary, water leaks and flooding, and lights left on, racking up the electricity bill. Some even discovered doors hanging wide open when rolling in.
“It’s always a smart move to have friends, family, or professionals keep an eye on your home while you’re away,” said Eskew. “It ensures any issues can be quickly addressed, so you can return to your home just as you left it — safe and sound. And with reliable security measures and remote monitoring in place, you can relax knowing your home is secure and only accessible to those you trust.”
AMERICA’S PRE-VACATION CHECKLIST
- Pack - 83%
- Do last-minute shopping for things to take on the trip - 70%
- Clean the house - 54%
- Make sure neighbors or family have a key to the house in case of an emergency - 50%
- Arrange for someone to care for the pet - 47%
- Clean out the refrigerator - 46%
- Arrange transportation - 45%
- Unplug appliances - 38%
- Pause regular deliveries (e.g. groceries, newspapers, etc.) - 31%
- Set the lights on a timer - 28%
- Download travel apps - 20%
- Program the home alarm - 19%
- Arranging for a house sitter - 12%
- Pick up dry cleaning - 7%
Survey methodology:
Talker Research surveyed 2,000 American homeowners; the survey was commissioned by Schlage and administered and conducted online by Talker Research between Aug. 2 and Aug. 6, 2024.
We are sourcing from a non-probability frame and the two main sources we use are:
● Traditional online access panels — where respondents opt-in to take part in online market research for an incentive
● Programmatic — where respondents are online and are given the option to take part in a survey to receive a virtual incentive usually related to the online activity they are engaging in
Those who did not fit the specified sample were terminated from the survey. As the survey is fielded, dynamic online sampling is used, adjusting targeting to achieve the quotas specified as part of the sampling plan.
Regardless of which sources a respondent came from, they were directed to an Online Survey, where the survey was conducted in English; a link to the questionnaire can be shared upon request. Respondents were awarded points for completing the survey. These points have a small cash-equivalent monetary value.
Cells are only reported on for analysis if they have a minimum of 80 respondents, and statistical significance is calculated at the 95% level. Data is not weighted, but quotas and other parameters are put in place to reach the desired sample.
Interviews are excluded from the final analysis if they failed quality-checking measures. This includes:
● Speeders: Respondents who complete the survey in a time that is quicker than one-third of the median length of interview are disqualified as speeders
● Open ends: All verbatim responses (full open-ended questions as well as other please specify options) are checked for inappropriate or irrelevant text
● Bots: Captcha is enabled on surveys, which allows the research team to identify and disqualify bots
● Duplicates: Survey software has “deduping” based on digital fingerprinting, which ensures nobody is allowed to take the survey more than once
It is worth noting that this survey was only available to individuals with internet access, and the results may not be generalizable to those without internet access.
17
views

Nearly 2 in 5 Americans at peak stress levels of this year
The average American feels like their head is spinning 156 times a year from stress, according to new research.
A survey of 2,000 adults found that these stress headaches break down to three times a week and that respondents recalled having brain fog just as often.
Looking at their current stress levels, the survey found that 41% said they’re at their peak stress for the year so far.
Conducted by Talker Research for Traditional Medicinals, results showed that while 30% are hopeful that their stress level will go down by the end of the year, a quarter of respondents think there’s a chance it’ll go up (26%).
Yet, 45% have never taken a mental health day or sick day from work solely because of stress.
Comparing their stress levels to previous years, 38% of those surveyed said that 2024 has been more stressful than 2023, but less so than 2022 and the preceding years.
What is it about this year that’s worsening their woes? Respondents can’t stop thinking about their finances (35%), the economy (28%) and their physical health (25%).
Others are bearing the burden of the news landscape — particularly the 2024 presidential election (20%) and other world issues (19%).
"With cold and flu season approaching, self care and stress management are more important than ever," said Kristel Corson, chief marketing officer at Traditional Medicinals. "Half of those surveyed believe that stress is often the main cause of them getting sick, and when asked what season is most stressful, the highest percentage of respondents (26%) said winter given seasonal changes and the holidays."
Respondents know they’re stressed when they have trouble sleeping (42%), feel irritable (37%), fatigued (34%), have headaches (33%) or feel worried or paranoid (31%).
Looking at how Americans combat these high-intensity moments, results showed that a majority feel overwhelmed during these times (58%).
Forty-seven percent turn on some music (47%), while another 39% look for comfort in their favorite TV shows and movies.
Food has its own calming effect, with nearly a fifth of respondents sharing that they have a snack (17%) or drink a cup of tea (14%) when they need to bring their stress down.
Seven in 10 agree that their overall mental health would be better if they were able to reduce their stress (71%), highlighting a need for self-care routines to be an important part of the stress solution.
However, incorporating self-care strategies into their daily life is a hurdle for one in seven Americans, leaving nearly half wishing for simple options that fit into their busy schedule (47%) as opposed to elaborate routines.
When thinking about a “de-stressing regimen,” an equal percentage of respondents want long-term overall wellness and the ability to alleviate stress quickly (23% each).
"We believe in integrating ancient herbal wisdom with modern scientific advancements for a holistic approach to wellness," said Corson. "Just 37% of survey respondents think that trendy stress relief options are successful, while nearly half felt confident in more traditional methods like yoga, meditation, or a calming tea."
MOST COMMON STRESS SYMPTOMS
1. Trouble sleeping — 42%
2. Irritability — 37%
3. Fatigue — 34%
4. Headaches — 33%
5. Feeling worried/paranoid — 31%
6. Inability to focus — 30%
7. Restlessness — 29%
8. Racing thoughts — 27%
9. Brain fog/mental unclarity — 23%
10. Panic attacks — 23%
WHAT’S STRESSING AMERICANS OUT?
1. Personal finances — 35%
2. The economy — 28%
3. Physical health — 25%
4. Family — 25%
5. Mental health — 24%
6. The 2024 presidential election — 20%
7. The news/world issues — 19%
8. Work — 16%
9. An unexpected life event — 15%
10. Romantic relationship — 13%
Survey methodology:
Talker Research surveyed 2,000 general population Americans; the survey was commissioned by Traditional Medicinals and administered and conducted online by Talker Research between July 29 and Aug. 5, 2024.
We are sourcing from a non-probability frame and the two main sources we use are:
● Traditional online access panels — where respondents opt-in to take part in online market research for an incentive
● Programmatic — where respondents are online and are given the option to take part in a survey to receive a virtual incentive usually related to the online activity they are engaging in
Those who did not fit the specified sample were terminated from the survey. As the survey is fielded, dynamic online sampling is used, adjusting targeting to achieve the quotas specified as part of the sampling plan.
Regardless of which sources a respondent came from, they were directed to an Online Survey, where the survey was conducted in English; a link to the questionnaire can be shared upon request. Respondents were awarded points for completing the survey. These points have a small cash-equivalent monetary value.
Cells are only reported on for analysis if they have a minimum of 80 respondents, and statistical significance is calculated at the 95% level. Data is not weighted, but quotas and other parameters are put in place to reach the desired sample.
Interviews are excluded from the final analysis if they failed quality-checking measures. This includes:
● Speeders: Respondents who complete the survey in a time that is quicker than one-third of the median length of interview are disqualified as speeders
● Open ends: All verbatim responses (full open-ended questions as well as other please specify options) are checked for inappropriate or irrelevant text
● Bots: Captcha is enabled on surveys, which allows the research team to identify and disqualify bots
● Duplicates: Survey software has “deduping” based on digital fingerprinting, which ensures nobody is allowed to take the survey more than once
It is worth noting that this survey was only available to individuals with internet access, and the results may not be generalizable to those without internet access.
18
views

How early is too early to prep for Thanksgiving?
Get your apron on: New research suggests that you should start your Thanksgiving preparations more than four weeks in advance.
Conducted by Talker Research on behalf of the Jennie-O brand, a recent survey of 100 Americans from each state investigated the best game plans along with different taste preferences when it comes to planning, cooking and enjoying the perfect Thanksgiving spread.
The results found both the guest list and the menu take upwards of two weeks of planning and cooking preparations add on another three days. It also involves an additional five hours of actual cooking and preparing on the day of the feast.
The longest prep time award goes to Delaware, averaging 17 days of guest list planning and another 19 days of menu building. Next in line is Virginia, where Americans spend almost 16 days picking guests (15.7) and nearly 17 days (16.6) on the menu, third only to North Carolina who averages a little more than 17 days (17.4) on their menu.
20
views

Can a good cup of coffee turn a bad day around?
Over half of Americans claim a good cup of coffee can be “so powerful,” it can turn their worst days around into good ones.
On the flip side, in a poll of 2,000 American coffee drinkers, 31% said their entire day can be ruined if their coffee isn’t right. Some are so in-tune with their coffee, they can tell when they’ve received the incorrect order based on if it doesn’t taste right (25%) or doesn’t look right (9%).
One in five even claimed having fresh coffee is “better than sex.”
Commissioned by La Colombe and Chobani and conducted by Talker Research, the study revealed how both hot coffee and iced coffee drinkers prefer their brews.
Over half (56%) of hot coffee drinkers prefer to keep their brew straightforward, simple and frills-free. Meanwhile, nearly as many iced coffee drinkers (51%) prefer to control every single aspect of their coffee, from the bean type to the brewing temperature and the method used.
The study discovered exactly what the “perfect” cup of coffee is most likely to be, universally: both hot and cold coffee drinkers like their brews medium roast (52%) and with a bold, earthy and chocolatey flavor profile (52%).
“Americans love their coffee and take seriously how it's made,” commented Kathryn O’Conner, Chief Marketing Officer at La Colombe. “Whether someone prefers hot or cold, a simple pour or a specialty drink with more complex flavors, what people care about most is having a drink made with quality and craftsmanship.”
The study also showed how people prefer to have their coffee served. Iced coffee drinkers were found to be more likely to use both sweeteners and creamers in their coffee (37%, compared to 31%).
They were also found to use more flavored creamers (creamers (24%, compared to 17%) and syrups (10%, compared to 2%).
According to both hot and cold drinkers, the best flavors for creamer and sweeteners are vanilla (52%), caramel (42%), caramel macchiato (42%), hazelnut (41%) and white chocolate mocha (33%).
Dessert flavors were also found to be popular, as many prefer sweet cream (31%), pumpkin spice (27%), peppermint mocha (20%), cinnamon coffee cake (17%) and cookie dough (16%) creamers.
“Creamers give people a fun and easy way to customize their coffee with different flavors,” said Niel Sandfort, Chobani Chief Innovation Officer. “Seasonal and indulgent, dessert-inspired flavors with nostalgic charm have been very popular recently, and now you can enjoy those tasty flavors in a totally natural way made with real cream and simple, clean ingredients — never with oil and nothing artificial.”
Where people get their coffee is also an important factor. While 70% prefer making their own at home and 12% prefer ordering in a café, 18% are happy with either location as long as they get their daily fix.
Survey methodology:
Talker Research surveyed 2,000 American coffee drinkers; the survey was commissioned by Chobani and La Colombe and administered and conducted online by Talker Research between August 26 and August 30, 2024.
24
views

Only one-third of Americans have natural disaster plans for pets
Just one-third of Americans have a disaster preparedness plan that includes their pet, according to new research.
The survey of 2,000 dog or cat owners revealed half of Americans (52%) believe natural disasters are unavoidable — and 29% find themselves losing sleep worrying about natural disasters and their homes.
Despite this fear about the occurrence of natural disasters, less than half (45%) of respondents have a natural disaster plan in place, and even then, their plan might not cover everything important — including resources for their pet.
Conducted by Talker Research on behalf of Hill’s Pet Nutrition, the survey results highlight the importance of preparing for natural disasters during National Preparedness Month in September.
Eight in 10 Americans feel it’s important to have a disaster preparedness plan for their pet. For respondents who do have a plan in place for their pet, their top concern is having enough food and water for their pet (73%).
That was followed by physically being able to transport their pet and their belongings (60%), and ensuring that they have an up-to-date disaster preparedness pet kit (48%).
The survey asked respondents about creating a pet emergency kit, including what necessities and comfort items they’d pack for their pets to ensure they are prepared.
Forty percent of respondents have kits prepared for their pets. For those, the top items they have included are food (85%), water (80%) and both water and food bowls (77% and 73%, respectively).
Treats are not forgotten, as 69% of pet owners make sure this is included in their pet’s kit.
Half (51%) also include their pet’s favorite toy, and a third (32%) will even put in clothes that smell like them, likely to help provide comfort to their pet in the case of an emergency.
"Disasters often strike with little warning, so it is crucial to have a plan in place to protect your family and your pets,” said Dr. Rebecca Tremble, Veterinarian and US Strategic Partnership Lead at Hill’s Pet Nutrition. “For over a decade, Hill’s Disaster Relief Network has coordinated emergency deliveries of pet food for organizations caring for pets impacted by crises. We also want to ensure pet parents are prepared before disaster strikes. In addition to creating a disaster plan, preparing a pet emergency kit will help you act quickly when needed. This kit should include essentials such as a three-day supply of your pets’ food and water, basic first aid supplies and a safety harness and leash.”
For respondents who have a plan in place for their pets, many still feel like they have areas in which to improve.
When thinking about ways to improve their preparedness plans, 42% want to ensure they have enough resources on hand, while others are focused on having enough money for their plan (39%) or keeping their kit up to date (36%).
In addition to preparing disaster kits, some pet owners have also microchipped their dogs (45%) and cats (34%) to ease the efforts in finding their pets in times of crisis.
The top stressors pet owners struggled with when preparing a disaster plan for their pets include knowing what to do if they got separated from their pet during a natural disaster (49%), having enough funds on hand (39%) and having enough resources (37%).
Pet owners don’t face these stressors alone, as respondents reported that their partner (45%), their kids (26%) and their pet’s veterinarian (22%) are all involved in the creation and execution of their pets’ disaster preparedness plans.
“When creating a preparedness plan for your pet, remember to also consult experts like your pets’ veterinarian and your local animal shelter,” said Dr. Roberta Westbrook, Chief Animal Welfare and Medical Officer at Houston SPCA. “They can offer advice and resources to help coordinate a comprehensive plan including checking that your pets’ microchips are updated and identifying pet-friendly locations in case you have to leave home.”
TOP 10 ITEMS INCLUDED IN DISASTER PREPAREDNESS KITS:
● Food 85%
● Water 80%
● Water bowl 77%
● Food bowl 73%
● Treats 69%
● A blanket 65%
● A leash 60%
● A pet carrier 56%
● Pet’s favorite toy 51%
● Pet’s collar 49%
Survey methodology:
Talker Research surveyed 2,000 American cat and dog owners; the survey was commissioned by Hill’s Pet Nutrition and administered and conducted online by Talker Research between Aug. 2, 2024, to Aug. 6, 2024.
We are sourcing from a non-probability frame and the two main sources we use are:
● Traditional online access panels — where respondents opt-in to take part in online market research for an incentive
● Programmatic — where respondents are online and are given the option to take part in a survey to receive a virtual incentive usually related to the online activity they are engaging in
Those who did not fit the specified sample were terminated from the survey. As the survey is fielded, dynamic online sampling is used, adjusting targeting to achieve the quotas specified as part of the sampling plan.
Regardless of which sources a respondent came from, they were directed to an Online Survey, where the survey was conducted in English; a link to the questionnaire can be shared upon request. Respondents were awarded points for completing the survey. These points have a small cash-equivalent monetary value.
Cells are only reported on for analysis if they have a minimum of 80 respondents, and statistical significance is calculated at the 95% level. Data is not weighted, but quotas and other parameters are put in place to reach the desired sample.
Interviews are excluded from the final analysis if they failed quality-checking measures. This includes:
● Speeders: Respondents who complete the survey in a time that is quicker than one-third of the median length of interview are disqualified as speeders
● Open ends: All verbatim responses (full open-ended questions as well as other please specify options) are checked for inappropriate or irrelevant text
● Bots: Captcha is enabled on surveys, which allows the research team to identify and disqualify bots
● Duplicates: Survey software has “deduping” based on digital fingerprinting, which ensures nobody is allowed to take the survey more than once
It is worth noting that this survey was only available to individuals with internet access, and the results may not be generalizable to those without internet access.
60
views
1
comment

What would parents give up for a healthy child?
The majority of parents would give up social media, vacations for life and even their best friend—all for their child’s well-being.
The survey of 2,000 parents of children aged 0–8 looked at what parents would be willing to give up if it meant their child was happy and healthy as the back to school season approaches, with the season’s first colds and flus to follow.
If their child could be healthy mentally and emotionally, parents would be willing to give up social media (76%), their smartphone (61%) and even electricity (39%).
Concerts (71%) and sporting events (71%) would also be off the table and 66% said they’d even give up trips and holidays for the peace of mind, knowing their child's wellbeing is in tip-top shape.
But activities weren’t the only thing on the table. Respondents were also asked about the relationships they’d be willing to forgo. Many said they would give up their best friend (60%), living with their partner (41%), or the ability to talk to their own parents (40%) if it could somehow keep their child from coming down with any illnesses or ailments.
Taking things a step further, the average parent would be willing to go more than $30,000 in debt in order for their child to be treated quickly for a cold or the flu for the rest of their lives.
Conducted by Talker Research on behalf of TYLENOL, the survey moved from these hypothetical “what ifs” to explore what it is parents actually do to keep their child as happy and healthy as they can.
Almost two-thirds (63%) of parents said keeping their child healthy is their top priority during the back to school season.
This may be why a majority noted that, in addition to new supplies (85%) and new clothes (82%), medications (52%) and hand sanitizer (75%) are just as essential on the back-to-school shopping list.
The average parent reported thinking about ways to keep their child happy and healthy more than 16 times per day and two-thirds of parents are more concerned about their child getting sick during the back-to-school season than any other time during the year.
In fact, parents report losing an average of five hours of sleep per night caring for their child when they’re sick.
“Looking at the data, it’s clear American parents are willing to give up pretty much anything if they could ensure their children would always be in good health physically and emotionally,” said Dr. Mona Amin, TYLENOL brand partner, Pediatrician and mom. “With back-to-school right around the corner, the lengths parents have already reported they’ve gone to in preparation for cold and flu season is astonishing. When choosing the right medicines, it’s important to pick trusted brands with historical reputations. Products that are dye-free and great tasting are a win-win for parents - ensuring you don't have to compromise between safety and your kid’s willingness to take the medicine.”
When asked how often respondents go through their medicine cabinets, throwing out old, expired items and replenishing with new products, nearly three-quarters (72%) said they don’t go longer than every few months and replenish an average of four times per year.
Two in five (41%) rarely find expired bottles; yet 10% admit that there’s a bottle between three and six years old lurking in the back.
Parents keep their medicine cabinets readily stocked with pain relievers and fever reducers (81%), cold and flu medications (77%), a thermometer (73%), tissues (68%) and cough drops (57%).
Still, 71% have needed specific medications for their child within the last year and found that they didn’t have it on-hand, and 38% of those parents went to several stores in order to find it.
In the case that all parents surveyed don’t have the medicine they need, 37% said there is no limit to how far they’d travel to get that medication with one in 10 (11%) explicitly noting they’d drive more than 50 miles.
More than one-third (36%) would even be willing to travel to more than 10 different stores to find it for their child.
WHAT WOULD AMERICAN PARENTS GIVE UP FOR HEALTHY AND HAPPY CHILDREN?
- Social Media - 76%
- TV - 66%
- Smartphone - 61%
- Food Delivery Services - 61%
- Friends - 60%
- WiFi - 55%
- Car - 45%
- Electricity - 39%
Survey methodology:
Talker Research surveyed 2,000 parents of kids ages 0-8; the survey was commissioned by TYLENOL and administered and conducted online by Talker Research between July 25 and July 31, 2024.
We are sourcing from a non-probability frame and the two main sources we use are:
● Traditional online access panels — where respondents opt-in to take part in online market research for an incentive
● Programmatic — where respondents are online and are given the option to take part in a survey to receive a virtual incentive usually related to the online activity they are engaging in
Those who did not fit the specified sample were terminated from the survey. As the survey is fielded, dynamic online sampling is used, adjusting targeting to achieve the quotas specified as part of the sampling plan.
Regardless of which sources a respondent came from, they were directed to an Online Survey, where the survey was conducted in English; a link to the questionnaire can be shared upon request. Respondents were awarded points for completing the survey. These points have a small cash-equivalent monetary value.
Cells are only reported on for analysis if they have a minimum of 80 respondents, and statistical significance is calculated at the 95% level. Data is not weighted, but quotas and other parameters are put in place to reach the desired sample.
Interviews are excluded from the final analysis if they failed quality-checking measures. This includes:
● Speeders: Respondents who complete the survey in a time that is quicker than one-third of the median length of interview are disqualified as speeders
● Open ends: All verbatim responses (full open-ended questions as well as other please specify options) are checked for inappropriate or irrelevant text
● Bots: Captcha is enabled on surveys, which allows the research team to identify and disqualify bots
● Duplicates: Survey software has “deduping” based on digital fingerprinting, which ensures nobody is allowed to take the survey more than once
It is worth noting that this survey was only available to individuals with internet access, and the results may not be generalizable to those without internet access.
53
views

Average American asks ‘What did you say?’ over 1,000 times a year
The average American will ask, “What did you say?” or an equivalent 1,095 times in a year, according to new research.
The survey of 2,000 general population Americans revealed respondents will need to ask someone to repeat themselves an average of three times per day because they didn’t hear the first time.
This adds up to about 91 times per month, or over one thousand times per year.
But despite the difficulty in hearing what others said, the average respondent will only ask twice before giving up on understanding and just pretending to have heard.
Conducted by Talker Research on behalf of Audien Hearing, the survey looked at the social impact this can have on respondents.
The results revealed that 35% of respondents have felt left out of a conversation because they couldn’t hear well, and while the outcomes of mishearing others can be funny, they can also be awkward and embarrassing — or even painful.
When asked for anecdotes of times they’ve misheard others, one respondent shared, “Down in Texas, my girlfriend was trying to tell me there was a loose horse and I didn't hear, and a horse ran right by me and knocked me down.”
Another respondent shared a time when their spouse caught them signing the lyrics wrong to a song: “The music aficionado in him required that I be corrected but the husband of 40+ years also knew gentleness and tact were required.”
A third said, “I had no idea what they said but I agreed and said yes. And before you knew I had to speak in front of a crowd.”
Perhaps because of the consequences of mishearing, almost a fifth of Americans surveyed (17%) admit they’ve avoided a social situation because of hearing difficulties. And this was higher for young Americans: 23% of Gen Z have done this, compared to just 11% of baby boomers surveyed.
“Whether you have hearing loss or not, nobody likes to ask someone to repeat themselves,” said Ishan Patel, the CEO at Audien Hearing. “But even for those who do have hearing loss, not everyone is ready to pull the trigger on hearing aids, so it’s very common for people to tune out of conversations when they can’t hear. That’s why we should recognize this and take corrective action when needed.”
The survey did ask respondents if they’ve been medically diagnosed with a hearing issue, and 16% of respondents have been — but another 21% worry they might have an undiagnosed hearing issue.
Regardless of whether they do or not, 40% of respondents believe their hearing has deteriorated over the past five years. For those respondents, they attribute this deterioration to age (62%) and exposure to loud noises in everyday life (32%).
Additionally, they believe some of their personal habits are playing a role — specifically, playing loud music in their car (32%), playing audio at a high volume using headphones (27%) and attending loud concerts (22%).
But while respondents are worried about their hearing, only half (49%) feel informed about the solutions for hearing issues.
They also shared barriers to seeking care for hearing-related issues, either now or in the future. This included the monetary cost of solutions (33%), their lack of knowledge about hearing loss (18%) and feeling embarrassed (15%).
And that feeling of embarrassment may be stopping respondents from getting hearing aids. Of the 93% who do not currently have hearing aids, 32% said they wouldn’t consider it, even if it was recommended by a medical professional.
“We always recommend seeking a medical opinion if you have hearing loss, but it’s important to know that your options have improved significantly in recent years,” said Patel. “Hearing aids used to cost nearly $5,000 per pair, required a prescription, and were bulky and unattractive.
“Now, due to technological advancements and new FDA guidelines, there are options for hearing aids over the counter for a fraction of the price, and many are much smaller and more discreet.”
* Free text responses may have been edited for length and/or clarity
Survey methodology:
Talker Research surveyed 2,000 general population Americans; the survey was commissioned by Audien Hearing and administered and conducted online by Talker Research between Aug. 13–16, 2024.
We are sourcing from a non-probability frame and the two main sources we use are:
● Traditional online access panels — where respondents opt-in to take part in online market research for an incentive
● Programmatic — where respondents are online and are given the option to take part in a survey to receive a virtual incentive usually related to the online activity they are engaging in
Those who did not fit the specified sample were terminated from the survey. As the survey is fielded, dynamic online sampling is used, adjusting targeting to achieve the quotas specified as part of the sampling plan.
Regardless of which sources a respondent came from, they were directed to an Online Survey, where the survey was conducted in English; a link to the questionnaire can be shared upon request. Respondents were awarded points for completing the survey. These points have a small cash-equivalent monetary value.
Cells are only reported on for analysis if they have a minimum of 80 respondents, and statistical significance is calculated at the 95% level. Data is not weighted, but quotas and other parameters are put in place to reach the desired sample.
Interviews are excluded from the final analysis if they failed quality-checking measures. This includes:
● Speeders: Respondents who complete the survey in a time that is quicker than one-third of the median length of interview are disqualified as speeders
● Open ends: All verbatim responses (full open-ended questions as well as other please specify options) are checked for inappropriate or irrelevant text
● Bots: Captcha is enabled on surveys, which allows the research team to identify and disqualify bots
● Duplicates: Survey software has “deduping” based on digital fingerprinting, which ensures nobody is allowed to take the survey more than once
It is worth noting that this survey was only available to individuals with internet access, and the results may not be generalizable to those without internet access.
43
views

At what age does life get real?
The age where life, money and the future start to feel “real” is officially 27 years old, according to new research.
A recent study of 2,000 Americans split evenly by generation (500 Gen Z, 500 millennials, 500 Gen X and 500 baby boomers) revealed that being an “adult” doesn’t automatically start the day you turn 18.
Today, a majority believe that the definition of “adulting” is simply paying your own bills (56%). Others say that being financially independent (45%) and putting responsibilities over their personal life or having fun (38%) are key markers of entering your adulthood era.
In fact, moving out of their parents’ or guardians’ house (46%) and getting their first career job or a job in their chosen field (28%) are two of the top events that made Americans feel like an adult.
Still, 11% of Gen Zers don’t feel like an adult.
The survey, conducted by Talker Research on behalf of Life Happens, explored Americans’ highs and lows, especially when it comes to finances, as well as the older generations’ advice for young adults.
Results found Americans start to take their finances seriously around the age of 28, and across the board, the older generations wish they’d taken their finances more seriously in their 20s (76%).
In terms of getting a credit card, budgeting and opening a savings account, millennials were ahead of the age 28 schedule and had done all three before that age, with both Gen X and baby boomers also opening savings accounts at an average age of 26.
Millennials came in at the nick of time and purchased life insurance at an average age of 28, though Gen X and baby boomers were both in their 30s (33 and 34, respectively).
Interestingly, Gen Z is well ahead of the curve in terms of paying their own bills, getting a credit card, learning how to budget and opening a savings account (all around the age of 22).
Yet still, more than half (53%) haven’t ever contributed to their 401(k) or retirement plan, and another 49% have yet to purchase life insurance.
The good news is that Gen Z is already taking much of the older generations’ financial advice: start saving early (64%), create a budget (46%) and start building credit as soon as you can (41%).
The bad news is that the next two biggest pieces of advice — contribute to your retirement fund (34%) and get life insurance while you’re young and healthy (18%) — are falling by the wayside.
Almost two in five Americans (39%) feel that they are not currently financially stable. And while Americans are hoping that they’ll be stable by the age of 46, 41% of those respondents don’t believe that they’ll ever achieve financial stability.
This was least true for Gen Z, as only 7% don’t believe that they’ll ever be financially stable, though that number increases exponentially with each generation: 30% of millennials don’t believe they’ll ever be financially stable, along with 53% of Gen X and 66% of baby boomers.
At the end of the day, 42% of all respondents found that being an adult is harder than they expected it to be.
“While it’s concerning to see that so many young people are not contributing to their retirement or purchasing life insurance, it’s never too late to start making those moves,” said Kevin Mayeux, the CEO of the National Association of Insurance and Financial Advisors. “More than half (56%) of all Americans surveyed have never worked with a financial professional. Working with someone who is experienced and trained in managing your finances can help you not only feel more secure today, but also for years to come.”
The survey also asked Gen Zers what the top thing they want older generations to know about or listen to when it comes to finances. One respondent said, “the economy is at a point where having financial security feels impossible, and like it's not worth attaining.”
Others said, “I'd emphasize the importance of understanding and adapting to the rapid changes in financial technology” and “buying a house is not as financially achievable at this time.”
Overall, the majority of Gen Z (81%) feel pressure to be more “ahead” financially than they currently are.
The survey also asked Americans a few hypothetical questions and found that finances are certainly top of mind. If they were given an additional $1,000, the majority (60%) would put it all in their savings account. Another 14% are equally likely to put that money into their 401(k) or to go on a nice vacation.
Still, Americans would rather spend $15 a month on life insurance (59%) than spend the same amount for a standard Netflix subscription (23%).
“Gen Z’s struggles and anxieties, paired with the fact that 71% of Americans surveyed believe that being an adult is harder today than it was 10 years ago, really underscores the importance of being financially prepared for whatever the future might hold,” said Brain Steiner, Executive Director at Life Happens. “Costs are rising, salaries are staying stagnant and hope is decreasing. While the future is unpredictable, your financial stability doesn’t have to be by preparing for the future with life insurance.”
Survey methodology:
Talker Research surveyed 2,000 Americans split evenly by generation (500 Gen Z, 500 millennials, 500 Gen X and 500 baby boomers); the survey was commissioned by Life Happens and administered and conducted online by Talker Research between August 12 to August 16, 2024.
12
views

These are America's top gardening hacks
Americans have revealed the most unusual hacks they use to help their gardens thrive, including using white vinegar as plant food, deterring cats with cinnamon – and singing to plants.
A poll of 2,000 adults revealed throwing used teabags onto the soil also made the list.
Using baking soda to make the soil more alkaline, sprinkling ash from the fireplace to act as a fertilizer, and watering plants with potato water were also cited as different gardening tricks.
It also emerged the average gardener spends three hours a week tending to their outdoor space, with people citing that some of their biggest gardening inspirations come from family, visiting other garden centers, and gaming.
“The research has revealed some weird and wonderful ways people tend to their gardens,” said Sabrina Carmona, VP of Farm Heroes Saga [https://to.king.com/updateFHS] at King – the mobile game developer behind the match 3 puzzle game, which commissioned the research.
“It’s been interesting to discover some of these and understand why tending to gardens has become such a popular pastime.
“Lots of people see gardening as an artform, much like the work that I do as a game developer.
“Like many people who love to tend to their garden, I’m always looking out for fresh ideas and inspiration that can help me to be more creative.”
The study found 67 per cent of those who garden do it because of the satisfaction they get from achieving results.
While 51 per cent claim it gives them somewhere to escape, and 48 per cent enjoy the nurturing aspect.
It emerged 65 per cent most enjoy watering plants, 36 per cent thrive from mowing the grass, and 51 per cent love harvesting their own fruit and veg.
Tomatoes, peppers, and cucumbers were the top three most popular produce to grow, with 44 per cent aiming to save money through this method.
American’s overall gardening goals include making their green space more visually appealing (56 per cent), improving mental wellbeing (55 per cent), and learning new skills (39 per cent).
However, 67 per cent would like to spend more time in their green space than they currently do.
What’s more, 92 per cent think it’s important to find time for the things you enjoy, with lack of time cited as the main reason why 67 per cent don’t garden as much as they would like to.
The study, conducted via OnePoll.com, also found 45 per cent would rather go to a garden center than a nightclub.
And 66 per cent believe gardening is an activity that all ages can enjoy – and not just for older people.
"Gardening is such a versatile and rewarding hobby that can be tailored to suit your lifestyle and space and can be enjoyed by all ages and abilities,” added Sabrina Carmona for Farm Heroes Saga.
“This inclusivity is something that’s demonstrated in the research and is also a foundational element of our game development.
“Whatever your background, age or circumstance, it’s so important to find moments of fun and enjoyment within our busy schedules.
“Gardening - whether that’s physically or virtually through a puzzle game - can bring countless benefits, from providing much needed moments of escapism, a sense of achievement or helping to learn a new skill.”
TOP 15 UNUSUAL HACKS TO HELP GARDENS GROW
1. Using used coffee grounds as a fertilizer
2. Using egg shells as fertilizer
3. Growing new fruit/vegetables from leftover vegetable roots/seeds
4. Talking to my plants
5. Using banana peels as fertilizer
6. Throwing used teabags onto the soil
7. Using ash from the fireplace as fertilizer
8. Sprinkling cayenne pepper to ward off pests
9. Using baking soda to make the soil more alkaline
10. Singing to my plants
11. Sprinkling cinnamon on the ground to deter cats
12. Using fish heads as fertilizer
13. Using potato water to water plants
14. Using white vinegar as a plant feed
15. Destroying fungus with cinnamon
24
views
1
comment

Do Americans trust their doctors?
A new survey has revealed, despite increased anxieties related to their health, Americans are feeling more confident consulting their doctor about their fears.
The third annual poll of 2,000 nationally represented U.S. adults asked respondents to share their thoughts, feelings and behaviors as they relate to the healthcare industry.
Results found 42% of Americans have a persistent anxiety that they have some undiagnosed health condition.
However, people are showing less fear talking about their health condition concerns with a doctor year-over-year — this year, 25% admitted they are afraid to talk to their healthcare provider about their conditions and symptoms; a major decrease from 2023 (46%) and 2022 (51%).
The survey, commissioned by PatientPoint and conducted by Talker Research, found a third of Americans have seen the level of trust in their healthcare provider increase over the past year.
Yet the increased trust in doctors themselves hasn’t entirely erased the inherent fear related to visiting a doctor’s office. In fact, over half (54%) said they feel a sense of anxiety before their doctor’s appointments — an upward trend from 39% in 2022 and 48% in 2023.
When asked why, respondents said they’re concerned about being judged (37%), not being able to afford treatment or medications (29%) or being referred to a specialist (29%).
The study found 82% of Americans have visited their doctor in the past 12 months, and many of them expressed what weighs heavily on their minds before visits.
One primary concern regarding Americans’ healthcare is lack of information: 53% said they wish they knew how to properly describe their conditions and symptoms better before talking to their healthcare provider.
Likewise, 49% said they’d love to have more information and advice on how to talk to their healthcare providers.
“A significant opportunity exists to more actively engage patients in their health journey,” said PatientPoint Founder and CEO Mike Collette. “Connecting patients with the right education before, during and after their visit empowers them to not only have more meaningful conversations with their doctor but ultimately make more informed decisions regarding their health.”
Despite these concerns, four in five (81%) felt like their healthcare provider listens to their concerns and only 37% leave their appointments feeling confused, which is down from 48% in 2022.
Respondents also noted other positive attributes related to their recent healthcare experiences. Those included: feeling more heard and respected by their doctors (66%), having an overall positive experience with their doctor (54%) and having a doctor that takes their background into account (37%).
Respondents also were seen to put more trust in the technology healthcare providers use. Thirty percent said they would trust the use of artificial intelligence (AI) in their doctor’s office.
Over half would trust wearables that track and collect data about their health (59%), interactive touchscreens in their doctor’s office (57%) and remote patient monitoring through their healthcare provider (56%).
Two in three (68%) said they’d trust online health portals where they can access education and medication information tailored to their health.
More than a quarter (28%) believe their health experience can be more personalized by having tailored medication information based on their condition, as well as having an exam room that welcomes them by name (20%) and tailored education sent to them before their visit (19%).
“As healthcare continues to become more personal, the need to give patients tailored information at every point along their unique health journey will be paramount,” said Collette. “We know when patients receive highly relevant content at the right time, it’s an incredibly powerful motivator that results in better health outcomes.”
Survey methodology:
Talker Research surveyed 2,000 nationally represented Americans; the survey was commissioned by PatientPoint and administered and conducted online by Talker Research between May 15 and May 20, 2024.
We are sourcing from a non-probability frame and the two main sources we use are:
● Traditional online access panels — where respondents opt-in to take part in online market research for an incentive
● Programmatic — where respondents are online and are given the option to take part in a survey to receive a virtual incentive usually related to the online activity they are engaging in
Those who did not fit the specified sample were terminated from the survey. As the survey is fielded, dynamic online sampling is used, adjusting targeting to achieve the quotas specified as part of the sampling plan.
Regardless of which sources a respondent came from, they were directed to an Online Survey, where the survey was conducted in English; a link to the questionnaire can be shared upon request. Respondents were awarded points for completing the survey. These points have a small cash-equivalent monetary value.
Cells are only reported on for analysis if they have a minimum of 80 respondents, and statistical significance is calculated at the 95% level. Data is not weighted, but quotas and other parameters are put in place to reach the desired sample.
Interviews are excluded from the final analysis if they failed quality-checking measures. This includes:
● Speeders: Respondents who complete the survey in a time that is quicker than one-third of the median length of interview are disqualified as speeders
● Open ends: All verbatim responses (full open-ended questions as well as other please specify options) are checked for inappropriate or irrelevant text
● Bots: Captcha is enabled on surveys, which allows the research team to identify and disqualify bots
● Duplicates: Survey software has “deduping” based on digital fingerprinting, which ensures nobody is allowed to take the survey more than once
It is worth noting that this survey was only available to individuals with internet access, and the results may not be generalizable to those without internet access.
52
views

How prepared are you for an emergency?
Americans are more likely to grab their cell phone than their social security card during an emergency evacuation, according to new research.
A survey of 2,000 U.S. adults split evenly by generation explored their most prized possessions and found exactly what items people consider most important.
Results revealed that in an emergency situation, Gen Zers are more likely to nab their laptop (35%) or a pair of shoes (35%) than prescription medications (30%) if they only have five minutes to evacuate.
Gen X, on the other hand, is the least likely to take clothing with them (33%) and would sooner take family photo albums (43%).
Meanwhile, baby boomers are more likely to grab their own jewelry, such as engagement rings or wedding bands, than they are to take water (21%) or food (17%) on their way out the door.
When asked about the most important item (not people or pets) in their home, it’s clear that Americans are clinging to sentimental value. Respondents had unique answers for things they’d grab, such as “the heart necklace that was my grandmother’s,” “the urns, [one] holding my husband, the other holding my son,” “the flag from my father's funeral for his service in the military” and even a “painting of a dog that my mom did when I was a kid.”
In order to keep those items forever, two in five respondents would sleep on the floor for the rest of their lives, while 11% would happily drain their entire back account. One in five millennials would even forgo marriage entirely if it meant they’d never lose their most important items.
In a more realistic sense, this may be why almost two-thirds of Americans (65%) take emergency preparedness more seriously today than they did 10 years ago.
The top reasons for being more prepared include concerns over the increase in natural disasters as a whole (48%), as well as having a family (47%) and pets (36%) to worry about.
The survey, conducted by Talker Research on behalf of Master Lock for National Preparedness Month, gave respondents 60 seconds to select items from the standard Federal Emergency Management Agency (FEMA) emergency preparedness checklist, mixed with a few other household items.
If a natural disaster was heading straight towards their home and respondents needed to evacuate quickly, a cell phone with a backup charger and battery (50%), important family documents, such as insurance policies and identification (45%), prescription medications (36%), food (36%) and water (33%) all ranked high on the list of items they’d take.
Other items on FEMA’s list were left behind, as many Americans would take family photos or albums (30%) over a first aid kit (28%) and a flashlight (28%), both of which are recommended by FEMA.
Overall, laptops (26%) also ranked above a complete change of clothing (24%), a sleeping bag or warm blanket for each person (21%) and sturdy shoes (15%).
The good news is that some Americans already have these emergency preparedness items in their homes: flashlights (50%), first aid kits (39%), extra batteries (39%), soap, hand sanitizer or disinfectant wipes (38%) and a manual can opener (31%).
Still, very few respondents had items such as a dust mask (15%), local maps (10%) or a whistler (8%), all of which are recommended items.
No matter if they’re at home or away, security is on Americans’ minds. When traveling, respondents worry about the safety and security of the items in their home an average of four times each day.
“Oftentimes, there is little to no time to prepare when disaster or an emergency strikes. Nearly one-third of Americans would rather lose their home than their belongings inside and this underscores the importance of protecting what’s most valuable to you,” said Kevin Gannon, VP, Category Management and Channel Marketing. “Whether living in areas susceptible to natural disasters or looking to put an emergency plan in place, look to security and safety storage solutions such as safes, fire/water chests and fire bags to protect your irreplaceable valuables.”
Not only are Americans taking overall preparedness more seriously, but they’re also prioritizing the importance of having an evacuation plan (86%) and security products in their home, such as water or fireproof safes (81%).
Almost all baby boomers (90%) emphasize the importance of having security products in their home.
Currently, Americans keep their most important items in their wallet (24%), in a closet (24%) or in a drawer (22%), while a little more than one in 10 Gen Zers stash their valuables under their bed (14%) or in/under their mattress (11%).
Yet still, 65% of Americans are more willing to purchase home security items than they were in the last decade, to keep their most valuable items protected.
More than one-third (36%) even admit that they are the most prepared person they know, followed by their partner or spouse (14%) and their mom (11%).
“Results found that only about one in five people already keep their most valuable items in a regular safe inside their home (22%) or a water/fireproof safe (19%),” said Gannon. “With an increase in natural disasters and in overall preparedness, it's important to ensure that the items you hold closest to your heart are safe in the event of an emergency.”
WHAT THINGS WOULD AMERICANS GRAB IN THE EVENT OF AN EMERGENCY?
● Cell phone - 74%
● Wallet/purse - 63%
● Birth certificate/passport/other documents - 62%
● Social security card - 56%
● Prescription medications - 43%
● Family photo albums - 41%
● Clothing - 40%
● Laptop - 31%
● Shoes - 30%
● Water - 25%
● Food/snacks - 25%
● My own jewelry (engagement rings, wedding bands, etc.) - 24%
● Over-the-counter medications (pain relievers, antacids, etc.) - 19%
● Toiletries - 17%
● Heirloom jewelry - 13%
● Gaming system - 10%
Survey methodology:
Talker Research surveyed 2,000 Americans split evenly by generation (500 Gen Z, 500 millennials 500 Gen X and 500 baby boomers); the survey was commissioned by Master Lock and administered and conducted online by Talker Research between August 15 and August 21, 2024.
We are sourcing from a non-probability frame and the two main sources we use are:
● Traditional online access panels — where respondents opt-in to take part in online market research for an incentive
● Programmatic — where respondents are online and are given the option to take part in a survey to receive a virtual incentive usually related to the online activity they are engaging in
Those who did not fit the specified sample were terminated from the survey. As the survey is fielded, dynamic online sampling is used, adjusting targeting to achieve the quotas specified as part of the sampling plan.
Regardless of which sources a respondent came from, they were directed to an Online Survey, where the survey was conducted in English; a link to the questionnaire can be shared upon request. Respondents were awarded points for completing the survey. These points have a small cash-equivalent monetary value.
Cells are only reported on for analysis if they have a minimum of 80 respondents, and statistical significance is calculated at the 95% level. Data is not weighted, but quotas and other parameters are put in place to reach the desired sample.
Interviews are excluded from the final analysis if they failed quality-checking measures. This includes:
● Speeders: Respondents who complete the survey in a time that is quicker than one-third of the median length of interview are disqualified as speeders
● Open ends: All verbatim responses (full open-ended questions as well as other please specify options) are checked for inappropriate or irrelevant text
● Bots: Captcha is enabled on surveys, which allows the research team to identify and disqualify bots
● Duplicates: Survey software has “deduping” based on digital fingerprinting, which ensures nobody is allowed to take the survey more than once
It is worth noting that this survey was only available to individuals with internet access, and the results may not be generalizable to those without internet access.
32
views

Best careers to pursue if you want to have a family
Can a career in tech make you a more present parent?
In a new poll of 2,000 Americans who have taken parental leave in the past, parents were asked which of the nation’s 15 biggest industries would better accommodate a family life if they were to change their career. According to them, tech is believed to be the most supportive (15%).
Likewise, tech was the top pick of industries when it came to supporting a flexible work schedule (17%) — a must-have for most parents today.
Commissioned by TripleTen and conducted by Talker Research, the survey revealed that the balancing act between work and children is challenging — 43% felt like they frequently have to prioritize their work over their children.
In fact, 55% considered leaving the workforce for an extended period of time to raise kids, beyond what a typical maternity or paternity leave would support and 59% of them followed through, leaving their careers to focus on raising their children.
On top of that, 74% would change their career path if it meant their employer was more accommodating of their family life.
Parents shared their current jobs lack modern benefits such as four-day work weeks (44%), unlimited PTO (30%), working exclusively or primarily from their home (30%), really good health insurance options (26%) and on-site childcare options (25%).
Sixty-nine percent would consider switching their career industries if it offered them “at least half” of the benefits they need to support their family.
Many parents see a career in the tech industry as the answer. Twelve percent of respondents said they currently work in tech. And of them, 61% believe the industry has allowed them to spend more time with their family than previous jobs would have allowed.
Likewise, 81% of them would encourage other parents to consider a career in tech for the same family-focused perks.
“It’s dangerously easy for parents to prioritize work when that’s what’s taking up the most amount of time in their day,” said Maggie Elentukh, VP of Communications and Brand at TripleTen. “But the end result of that prioritization is missing out on critical moments that no parent ever wants to miss. Parents are entitled to spend as much time with their children as they can, and their careers should support that focus.”
Results from the survey also found 42% of parents believe they don’t spend enough time with their children during the typical working day, and 58% have had their kids ask to spend more time with them.
Over half (56%) have had to miss out on events their kids have participated in because of a work obligation.
Nearly all parents (96%) said they felt guilty putting work before their kids, and they recalled missing out on activities such as field trips (46%), sporting events (45%), parent-teacher nights (38%) and meals (38%).
Four in five (82%) admitted they have called out of work or left early to make sure they don’t miss out on the events their kids are involved in.
A third have even lied to their bosses to get the day off — 64% of whom said they do it “guilt-free.”
“There’s a lot of potential for familial support in modern working industries, such as the tech sector,” continued Maggie. “The tech industry is a leading example of what a good work/life balance can bring — an efficient level of productivity seen in the workday, as well as making sure parents have the resources and infrastructure in their workplace to ensure they never miss a moment of their child’s life.”
WHAT ARE PARENTS MISSING OUT ON BECAUSE OF WORK?
- Joining on a field trip - 46%
- A sports event - 45%
- School conferences/parent-teacher nights - 38%
- Meals - 38%
- A sports practice - 37%
- Family outings (a day trip) - 32%
- Celebrations - 31%
- A music recital/theater performance - 28%
- Their birthday party - 17%
- A family vacation - 15%
Survey methodology:
Talker Research surveyed 2,000 American parents who have taken leave from work for raising children; the survey was commissioned by TripleTen and administered and conducted online by Talker Research between July 9 and July 19, 2024.
We are sourcing from a non-probability frame and the two main sources we use are:
Traditional online access panels — where respondents opt-in to take part in online market research for an incentive
Programmatic — where respondents are online and are given the option to take part in a survey to receive a virtual incentive usually related to the online activity they are engaging in
Those who did not fit the specified sample were terminated from the survey. As the survey is fielded, dynamic online sampling is used, adjusting targeting to achieve the quotas specified as part of the sampling plan.
Regardless of which sources a respondent came from, they were directed to an Online Survey, where the survey was conducted in English; a link to the questionnaire can be shared upon request. Respondents were awarded points for completing the survey. These points have a small cash-equivalent monetary value.
Cells are only reported on for analysis if they have a minimum of 80 respondents, and statistical significance is calculated at the 95% level. Data is not weighted, but quotas and other parameters are put in place to reach the desired sample.
Interviews are excluded from the final analysis if they failed quality-checking measures. This includes:
● Speeders: Respondents who complete the survey in a time that is quicker than one-third of the median length of interview are disqualified as speeders
● Open ends: All verbatim responses (full open-ended questions as well as other please specify options) are checked for inappropriate or irrelevant text
● Bots: Captcha is enabled on surveys, which allows the research team to identify and disqualify bots
● Duplicates: Survey software has “deduping” based on digital fingerprinting, which ensures nobody is allowed to take the survey more than once
It is worth noting that this survey was only available to individuals with internet access, and the results may not be generalizable to those without internet access.
37
views

Research reveals top aging concerns for women
How are women today approaching aging? According to a new survey, almost half of women (47%) express that aging causes them stress.
A survey of 2,000 American women split evenly by generation revealed that Gen Z (56%) and millennials (57%) are more stressed about getting older than Gen X (46%) and baby boomers (31%).
In fact, both millennials (38%) and Gen Z (40%) lead the charge with feeling older than their age. Further, 18% of Gen Z believe that they appear older, more than any other generation.
Still, more than three-quarters (76%) say they are trying to embrace aging with grace.
Conducted by Talker Research on behalf of NEOSTRATA, results revealed that over half of women (54%) are concerned others will notice signs of them aging.
Further, almost half of women noticed the first signs of aging skin by the age of 40. Fine lines on their face (44%) and forehead wrinkles (32%) were two signs that women noticed most often, along with age spots (32%) and creases or lines in their neck (15%)
To help combat aging skin and avoid these signs from appearing, 70% of women surveyed take their skincare routines seriously and 64% use between one and four different products on any given day.
For most (81%), those products target the whole face, but when asked if they use products that target areas beyond the face or products that address specific concerns, such as the neck, eyes or arms, less than 40% of women confirmed they were using these types of skincare products.
In fact, only 17% of women say they pay significant attention to caring for their neck, with less than one-third of women (29%) using a skincare product on their neck on a daily basis.
“Taking care of my skin helps me to feel confident and good about myself. I was surprised to hear about how many women are still neglecting their neck." said Jenna Dewan, actress, dancer and NEOSTRATA spokesperson. “I was lucky my mom always told me to extend my facial skincare down to my neck, but it seems many women still don’t realize that the neck is often one of the first places to show signs of aging. It’s so important to incorporate skincare products that target your neck to prevent fine lines and wrinkles.”
Further, only 32% of women are confident they know how to properly care for their neck to prevent signs of aging.
Almost three in five (58%) say they take steps to avoid behaviors or habits that are bad for their skin. But still, women more so attribute aging to factors such as stress levels (55%), bad habits, such as smoking or lack of sleep (39%) or lack of using sunscreen (33%).
Surprisingly, less than one in 10 (7%) blame technology and only 25% are aware of the concept of “tech neck.”
“’Tech neck’ refers to wrinkles that can appear across the neck due to the position of the head and face when looking down at a laptop or phone for long periods of time,” said dermatologist and NEOSTRATA partner Dr. Alexis Stephens. “With technology playing an integral part in our everyday lives, it’s important to modernize skincare routines and introduce products, such as a neck cream, to target the fine lines and wrinkles that can be caused by ‘tech neck.’ The skin on our neck and decolletage area is very sensitive and will inevitably be the first to give away our age. Time spent on preventing these key signs of aging will help women to feel and look their age in the long-term.”
Survey Methodology:
Talker Research surveyed 2,000 American women split evenly by generation (500 Gen Z, 500 millennials, 500 Gen X and 500 baby boomers); the survey was commissioned by NEOSTRATA and administered and conducted online by Talker Research between July 22 and July 29, 2024. Those who did not fit the specified sample were terminated from the survey. As the survey is fielded, dynamic online sampling is used, adjusting targeting to achieve the quotas specified as part of the sampling plan.
40
views

Paris dethroned as top romantic travel destination: new survey
Move over, Paris — there’s a new city of love.
A survey of 2,000 Americans looked at some of the most romantic travel destinations in the world and found that Maui, Hawaii was voted as the top pick this year (34%).
While many respondents still cherish the intimacy that Paris brings (33%), results showed that scenic destinations like Rome, Italy (29%) or Santorini, Greece (11%) can hold their own.
Others look to beachy and tropical locations to feel the spark, like Cancun, Mexico (19%), Costa Rica (13%) and the British Virgin Islands (12%).
Conducted by Talker Research in partnership with Funjet Vacations, the survey found that although respondents are yearning to visit these popular destinations, a majority believe that hidden or smaller destinations are more romantic (69%).
Similarly, more Americans acknowledge that lesser-known destinations are better for setting the mood to be intimate with a partner (45%) and bonding with them overall (45%).
No matter where they go, traveling puts respondents in the mood: on average, those surveyed estimate they’re about 62% more romantic on vacation than during their regular life.
In fact, half of single respondents said that one of the best parts of traveling is the potential to find love.
If they were traveling with a partner, those surveyed would put their love on display by going for walks on the beach (55%), watching sunsets together (54%) or holding hands (53%).
“Vacationing together isn't just about discovering new places; it's about igniting, deepening, or rekindling the romance, escaping the ordinary and celebrating the love that binds you," said Dana Studebaker, vice president of marketing of consumer brands at Funjet Vacations. "The beauty of all-inclusive resorts is that they offer the perfect stress-free escape, removing the hassle of planning and allowing you to focus entirely on each other."
But according to Americans, vacationing with a partner isn’t for those interested in flings: three-quarters consider traveling with a partner to be a serious step in the relationship (76%).
On average, respondents believe you should be with a partner for about a year before traveling with them, although 42% would do so before that benchmark.
The wait is well worth it for seven in 10 who agree that traveling with a partner is one of the most romantic things to do together (71%).
Sometimes the best trips need the least planning, as more respondents think that a spontaneous trip with a partner is more romantic than a trip planned in advance (50% vs. 34%).
If you’re looking to impress a lover, vacationing together may be the way to their heart, as 72% agree that spontaneous trips with a partner are sexy.
It may be time for those interested in getting lucky on vacation to start their planning.
One in five believe that the best time to travel is during “cuffing season” (22%) — October to mid-February, where people are focused on finding or maintaining relationships during the colder months of the year.
Nearly a third of those who aren’t in a serious relationship are hopeful that they’ll have a partner this upcoming cuffing season (31%).
And the same percentage, regardless of their relationship status, have plans to travel with a partner this cuffing season.
“When planning your vacation, I always recommend including activities like yoga, snorkeling, paddleboarding, cooking classes, hiking, wine tastings and more, as they help travelers bond in their relationships and offer opportunities to create in-person connections with new people over a shared interest or new adventure," said Michael Lowery, head of global consumer business, Funjet Vacations. “One of the perks of choosing an all-inclusive resort is that these experiences are right at your fingertips and come at no extra charge.”
MOST ROMANTIC DESTINATIONS TO VISIT WITH A PARTNER
1. Maui, Hawaii — 34%
2. Paris, France — 33%
3. Rome, Italy — 29%
4. Venice, Italy — 27%
5. Cancun, Mexico — 19%
6. Tuscany, Italy — 16%
7. Costa Rica — 13%
8. British Virgin Islands — 12%
9. St. Lucia — 11%
10. Santorini, Greece — 11%
11. Aspen, Colorado — 11%
12. New York City, New York — 9%
13. Turks and Caicos — 9%
14. Provence, France — 8%
15. The Amalfi Coast, Italy — 7%
Survey methodology:
Talker Research surveyed 2,000 general population Americans; the survey was commissioned by Funjet Vacations and administered and conducted online by Talker Research between July 23 and July 29, 2024.
We are sourcing from a non-probability frame and the two main sources we use are:
● Traditional online access panels — where respondents opt-in to take part in online market research for an incentive
● Programmatic — where respondents are online and are given the option to take part in a survey to receive a virtual incentive usually related to the online activity they are engaging in
Those who did not fit the specified sample were terminated from the survey. As the survey is fielded, dynamic online sampling is used, adjusting targeting to achieve the quotas specified as part of the sampling plan.
Regardless of which sources a respondent came from, they were directed to an Online Survey, where the survey was conducted in English; a link to the questionnaire can be shared upon request. Respondents were awarded points for completing the survey. These points have a small cash-equivalent monetary value.
Cells are only reported on for analysis if they have a minimum of 80 respondents, and statistical significance is calculated at the 95% level. Data is not weighted, but quotas and other parameters are put in place to reach the desired sample.
Interviews are excluded from the final analysis if they failed quality-checking measures. This includes:
● Speeders: Respondents who complete the survey in a time that is quicker than one-third of the median length of interview are disqualified as speeders
● Open ends: All verbatim responses (full open-ended questions as well as other please specify options) are checked for inappropriate or irrelevant text
● Bots: Captcha is enabled on surveys, which allows the research team to identify and disqualify bots
● Duplicates: Survey software has “deduping” based on digital fingerprinting, which ensures nobody is allowed to take the survey more than once
It is worth noting that this survey was only available to individuals with internet access, and the results may not be generalizable to those without internet access.
74
views
1
comment

Why frontline workers are quitting their jobs
One in five frontline workers feel so overwhelmed by information at their job, they've considered quitting.
A new poll of 1,000 U.S. workers in retail, food service, fitness and hospitality industries found that overall, 83% of workers feel overwhelmed to some degree by the amount of information they need to do their job properly.
Many pin the source of their work-related stress on not knowing certain skills as part of their job role (43%). Over half (55%) also admitted they’re more likely to make a mistake if they’re feeling stressed by their job.
Adding to their stress, three in four struggle on some level to stay updated on what information is needed for their job.
Commissioned by Wisetail and conducted by Talker Research, the study found three in 10 are either unsure or positive their company isn’t able to provide them with up-to-date and consistent resources for their training.
However, many workers believe when their employers do give them proper information resources, it can make a world of difference.
Eighty-three percent said it’s easy for them to learn skills for their role thanks to company-provided training either in-person (78%), online (62%) or through a paper resource (50%).
And as a result, 52% said they frequently learn something new in their role. Indeed, only 2% claimed they “never” learn anything new from their job.
“It’s very easy to get overwhelmed by information, and that can absolutely lead to making mistakes,” said Ali Knapp, President at Wisetail. “As some of these respondents said it, it’s important to not rush into it and to take time to learn about their role and really lean into the resources your company provides.”
Results also found 69% of workers believe their current role has given them skills to be used in the future for their longer-term career. In fact, just as many consider their jobs to be a long-term career opportunity, rather than just a short-term role.
And 70% would likely continue working with their current organization if they were to be offered a long-term position at the company.
The average person has worked their current role for more than two years and needed the first five months to learn how to do their role, with another four months to understand what it is they do on a daily basis.
Most (84%) said their job’s responsibilities met their original expectations when they applied.
“It’s clear that people care about their jobs and want to keep working with their current companies,” continued Knapp. “Employees can see that, without the strain of information overload, if their companies provide them with the right tools, resources and learning opportunities they would be set up for success.”
Survey methodology:
Talker Research surveyed 1,000 Americans who are frontline workers in the restaurant, quick serve, fast casual, hospitality, retail and fitness industries; the survey was commissioned by Wisetail and administered and conducted online by Talker Research between Apr. 29 and May 8, 2024.
We are sourcing from a non-probability frame and the two main sources we use are:
• Traditional online access panels — where respondents opt-in to take part in online market research for an incentive
• Programmatic — where respondents are online and are given the option to take part in a survey to receive a virtual incentive usually related to the online activity they are engaging in
Those who did not fit the specified sample were terminated from the survey. As the survey is fielded, dynamic online sampling is used, adjusting targeting to achieve the quotas specified as part of the sampling plan.
Regardless of which sources a respondent came from, they were directed to an Online Survey, where the survey was conducted in English; a link to the questionnaire can be shared upon request. Respondents were awarded points for completing the survey. These points have a small cash-equivalent monetary value.
Cells are only reported on for analysis if they have a minimum of 80 respondents, and statistical significance is calculated at the 95% level. Data is not weighted, but quotas and other parameters are put in place to reach the desired sample.
Interviews are excluded from the final analysis if they failed quality-checking measures. This includes:
• Speeders: Respondents who complete the survey in a time that is quicker than one-third of the median length of interview are disqualified as speeders
• Open ends: All verbatim responses (full open-ended questions as well as other please specify options) are checked for inappropriate or irrelevant text
• Bots: Captcha is enabled on surveys, which allows the research team to identify and disqualify bots
• Duplicates: Survey software has “deduping” based on digital fingerprinting, which ensures nobody is allowed to take the survey more than once
It is worth noting that this survey was only available to individuals with internet access, and the results may not be generalizable to those without internet access.
39
views

Study finds what drives us to procrastinate
It’s official — procrastination o’clock hits at 12:06 p.m. on a Monday, according to new research.
From watching TV and movies (50%), to simply laying in bed (39%) or taking a nap (29%), a survey of 2,000 U.S. adults revealed that procrastination plagues the nation, as 71% of Americans are guilty of procrastinating.
Still, 76% admit that they feel guilty when doing so.
Another place Americans will turn is to their phone, scrolling through social media to avoid their to-do list (42%).
The average American spends almost two and a half hours on social media every single day, despite trying to limit their consumption to just under two hours (1.9).
Still, 10% spend between five and eight hours scrolling and 18% don’t even attempt to try and limit their social media time.
Taking that a step further, half of Americans agree that their phone is like a fifth appendage and are only inspired to put it down for family dinners (50%), special events, such as birthdays or weddings (35%) or dates (22%).
Aside from social scrolling, respondents are also putting off tasks by playing video games (22%) and calling family and friends (19%). This may be why 28% admit that their phone is usually the main reason why they aren’t getting things done.
Conducted by Talker Research on behalf of Dave’s Killer Bread, results also found that respondents would also rather grab a bite to eat (33%), go for a walk (30%) or drive (20%) or simply do nothing (31%) than tackle their to-do list.
Many can be swayed to start crossing items off if they’re expecting friends or family (30%) or have the perfect snack (17%) and playlist (17%).
Another 34% are likely to “gamify” their agenda, and reward themselves with a snack (30%) or quick social media scroll (25%) upon completing a task.
Others are likely to enlist the rest of the household (14%) and will stage a competition with one another (19%) or pretend they’re on a gameshow (14%).
"Tackling your to-do list isn't always the most exciting part of the day, and with so many distractions, it’s easy to find ourselves procrastinating,” said Jillian Cohn, Director of Brand Management for Dave’s Killer Bread. “The good news is that something as simple as an energy-boosting snack or your favorite playlist can improve your mood and motivation. Incorporating these small pleasures into your day can transform your approach to getting things done."
When asked the smallest or strangest things they’ve procrastinated, Americans outlined scenarios such as, “washing my hair,” “using the restroom,” “trimming my toenails,” “taking out the trash” and even “making a phone call.”
Regardless, 70% find that they’re able to cross more things off their to-do list when they’re alone than with help from others.
And another 55% even admit they’re more likely to put things off if they’re hungry.
But when it’s all said and done, almost one in five (19%) find that the tasks they’d been putting off always take a shorter amount of time than expected.
"Even the smallest tasks can sometimes feel overwhelming, and that's perfectly normal. It's important to be kind to yourself and celebrate your wins, no matter how big or small,” Cohn added. “Whether you're tackling your daily tasks or taking a much-needed break, a tasty and nutritious snack can be just what you need to recharge and keep you on track."
WHAT WOULD AMERICANS RATHER DO THAN THEIR TO-DO LIST?
● Take a nap - 39%
● Visit with family and friends - 33%
● Grab a bite to eat - 33%
● Do nothing - 31%
● Go for a walk - 30%
● Go shopping - 28%
● Go for a drive - 20%
● Work out - 16%
● Catch up on work - 10%
Survey methodology:
Talker Research surveyed 2,000 general population Americans; the survey was commissioned by Dave’s Killer Bread and administered and conducted online by Talker Research between July 19 to July 22, 2024.
We are sourcing from a non-probability frame and the two main sources we use are:
● Traditional online access panels — where respondents opt-in to take part in online market research for an incentive
● Programmatic — where respondents are online and are given the option to take part in a survey to receive a virtual incentive usually related to the online activity they are engaging in
Those who did not fit the specified sample were terminated from the survey. As the survey is fielded, dynamic online sampling is used, adjusting targeting to achieve the quotas specified as part of the sampling plan.
Regardless of which sources a respondent came from, they were directed to an Online Survey, where the survey was conducted in English; a link to the questionnaire can be shared upon request. Respondents were awarded points for completing the survey. These points have a small cash-equivalent monetary value.
Cells are only reported on for analysis if they have a minimum of 80 respondents, and statistical significance is calculated at the 95% level. Data is not weighted, but quotas and other parameters are put in place to reach the desired sample.
Interviews are excluded from the final analysis if they failed quality-checking measures. This includes:
● Speeders: Respondents who complete the survey in a time that is quicker than one-third of the median length of interview are disqualified as speeders
● Open ends: All verbatim responses (full open-ended questions as well as other please specify options) are checked for inappropriate or irrelevant text
● Bots: Captcha is enabled on surveys, which allows the research team to identify and disqualify bots
● Duplicates: Survey software has “deduping” based on digital fingerprinting, which ensures nobody is allowed to take the survey more than once
It is worth noting that this survey was only available to individuals with internet access, and the results may not be generalizable to those without internet access.
58
views
1
comment
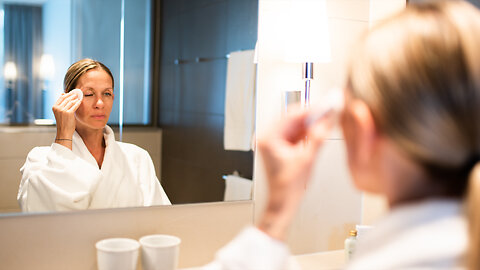
Average American starts caring about their skin at this age
Americans only start taking their sun-related skincare seriously at age 26, according to new research.
The poll of 2,000 U.S. adults found that before their mid-20’s, Americans aren’t taking proper care of their skin — which might be why respondents are four times as likely to get scalded by the sun than they are to use sunscreen.
The survey found 79% have experienced sunburn, while only a fifth admit to using facial sunscreen (20%) or body sunscreen (21%) daily.
Commissioned by Melanoma Research Alliance, the largest private nonprofit funder of melanoma research, and conducted by Talker Research, the survey also looked at the habits of different generations regarding sun protection.
Younger generations appear to be taking their skin health more seriously than older generations, as the results revealed that Gen Z are more likely to wear sunscreen daily, whether that’s body or facial sunscreen.
Over a third of Gen Z respondents reported wearing sunscreen daily (34% body, 35% facial), compared to about a fifth of Gen Xers (23% body, 18% facial).
The survey also looked at how sunscreen usage varies by season, with one in five Americans dropping the use of sunscreen all together post Labor Day.
Despite the chance of a sunburn regardless of the weather, seven in 10 Americans think sunscreen is a “summer essential” while only three in 10 respondents include sunscreen in their “winter essentials.”
No matter the season, 54% of those who have had sunburns are concerned about having irreversible damage to their skin.
The survey revealed that the top reasons motivating people to wear sunscreen include concerns about skin cancer risks (41%), the convenience of sunscreen incorporated into daily moisturizers (31%) and fears of premature skin aging (22%).
The survey showed that women were more concerned about skin cancer risks than men. Only 39% of men report that the risk of skin cancer would encourage them to wear sunscreen daily, compared to women (42%).
Despite 72% of Americans feeling knowledgeable about sun protection and 81% feeling informed about the risks of melanoma skin cancer, many respondents still aren’t incorporating sunscreen into their routine.
Seventy-two percent of respondents reported making sure that they have sunblock on when outdoors or in direct sunlight, while only 3% do so in less expected but potentially harmful situations such as when looking at a screen, on an airplane or at a nail salon.
“There are many common misconceptions about the importance of sunscreen and protecting your skin from the sun,” says Dr. Marc Hurlbert, CEO of Melanoma Research Alliance. “No matter if it’s a sunny or cloudy day, if you plan to stay indoors, or if you’re sitting by a window, in a plane, or in a car, it’s important to wear sunscreen daily – all year round – to protect yourself from harmful rays that can cause melanoma.”
When looking for more information about sun protection, respondents were equally likely to turn to search engines like Google as they were their doctor (32%).
Twelve percent also turn to social media, with Facebook (57%), YouTube (53%) and TikTok (47%) as the top platforms respondents are looking at for their queries about sun protection.
The survey data reveals that 39% of Gen Z prefer online search engines for sun protection, while 44% turn to social media, with 8% deciding to not rely on any specific source for such information.
Not only are respondents lacking the use of sunscreen in their everyday lives, but they are also lacking visits to the dermatologist as only 34% of Americans surveyed see a dermatologist, with 21% of them visiting less than once a year.
The survey also reveals that 54% of respondents prioritize their normal doctor appointments over dermatology visits, and about half are more likely to see a dermatologist for other skin-related issues like rashes, itchiness or eczema rather than to check for melanoma.
Despite the risks of melanoma, the survey also revealed various factors that influence people to not wear sunscreen, including the time of year (28%), overcast or rainy weather (23%), and daily UV index levels (12%).
“At Melanoma Research Alliance, we always say the best sunscreen is the type that you’ll use daily,” says Hurlbert. “Whether it’s mineral or chemical sunscreen, or paired with the use of wide brimmed hats and UPF clothing, it’s important to protect yourself daily, and visit your dermatologist annually for a skin check.”
TOP 7 REASONS WHY AMERICANS DECIDE TO WEAR SUNSCREEN:
● Avoiding sunburns 58%
● Concerns about skin cancer 56%
● Preventing premature skin aging 39%
● Skincare benefits 31%
● Doctor recommendations 19%
● Avoiding getting tanner 8%
● Social Media 6%
Survey methodology:
Talker Research surveyed 2,000 Americans; the survey was commissioned by Melanoma Research Alliance and administered and conducted online by Talker Research between Aug. 3 to Aug. 8, 2024.
We are sourcing from a non-probability frame and the two main sources we use are:
● Traditional online access panels — where respondents opt-in to take part in online market research for an incentive
● Programmatic — where respondents are online and are given the option to take part in a survey to receive a virtual incentive usually related to the online activity they are engaging in
Those who did not fit the specified sample were terminated from the survey. As the survey is fielded, dynamic online sampling is used, adjusting targeting to achieve the quotas specified as part of the sampling plan.
Regardless of which sources a respondent came from, they were directed to an Online Survey, where the survey was conducted in English; a link to the questionnaire can be shared upon request. Respondents were awarded points for completing the survey. These points have a small cash-equivalent monetary value.
Cells are only reported on for analysis if they have a minimum of 80 respondents, and statistical significance is calculated at the 95% level. Data is not weighted, but quotas and other parameters are put in place to reach the desired sample.
Interviews are excluded from the final analysis if they failed quality-checking measures. This includes:
● Speeders: Respondents who complete the survey in a time that is quicker than one-third of the median length of interview are disqualified as speeders
● Open ends: All verbatim responses (full open-ended questions as well as other please specify options) are checked for inappropriate or irrelevant text
● Bots: Captcha is enabled on surveys, which allows the research team to identify and disqualify bots
● Duplicates: Survey software has “deduping” based on digital fingerprinting, which ensures nobody is allowed to take the survey more than once
It is worth noting that this survey was only available to individuals with internet access, and the results may not be generalizable to those without internet access.
11
views

Nearly 80% of Americans too tired to cook after work
Eight in 10 Americans are too tired to cook themselves a meal after work, according to new research.
The survey of 2,000 general population Americans revealed 77% admit there are days where, after work, they’re too exhausted to cook.
And a fifth of respondents have been so tired while trying to cook — they’ve actually fallen asleep while making their food.
The research, conducted by Talker Research and commissioned by Kevin’s Natural Foods, looked at when respondents are at their busiest, and the specific impact that has on what they eat.
9
views

These are the greatest reality shows of all time
The golden buzzer has spoken — “America’s Got Talent” has been crowned America's favorite reality TV show, according to a new survey.
Conducted by Talker Research on behalf of JaM Cellars, the makers of Butter wines, the poll of 2,000 U.S. reality TV fans split evenly by generation (500 Gen Z, 500 millennials, 500 Gen X and 500 baby boomers) looked at America’s obsession with reality TV and took a deep dive into the greatest shows of all time.
Results found that the U.S. is particularly obsessed with talent, as “America’s Got Talent” (42%) was followed by “American Idol” (33%) in the No. 2 spot. “Family Feud” (31%) fell into third, with MTV’s classic “Catfish” (29%) and TLC’s drama-dripping “90-Day Fiancé” series rounding out the top five.
The average American watches reality TV four days per week, though 31% admit to doing so every single day. This totals an average of 10 hours of reality TV viewing each week, with 20% logging between 10 and 18 hours.
39
views

How Americans are reinventing retirement
Retirees are living lives their younger selves would be jealous of, according to a recent study.
The poll of 2,000 Americans who have retired, or will retire, between 2020–2029 found that the Benjamin Button effect is in full play.
Retirees said they’re aging backward and feeling more vivacious than ever — as more than a quarter (26%) said their younger self would love to live their current life.
And most respondents (60%) plan to, or already have, done a “retirement reinvention” — stepping into a completely new version of themselves during retirement.
Commissioned by IHG Hotels & Resorts and conducted by Talker Research, the survey explored what this “new version” looks like, and the role that travel plays in respondents making the most of their retirement years.
Many retirees (40%) have taken, or plan to take, the trip of a lifetime to celebrate retirement.
In fact, the majority (59%) are planning on traveling more during retirement than they traveled during their working years.
This may be due in part to 36% of retirees regretting how much they worked during their careers, compared to how much time they spent doing other things.
Looking back at their priorities while working, respondents said their biggest roadblocks to traveling during their careers were lack of budget (49%) and job flexibility (43%).
But to make up for this, half want to spend less in other areas of their budgets, so they’re able to put more money toward travel — and the survey looked to see what places are top on the list of where retirees want to visit.
Of those who have or will take a retirement celebration trip, top stops are a destination within the U.S. (59%), Europe (31%) and a North American locale outside of the U.S. (23%).
A few adventurers are even trekking to Antarctica for their retirement trip.
“It’s incredible to see how many people are taking advantage of their retirement to enjoy things they didn’t have time for in their working years,” said Connor Smith, vice president of masterbrand at IHG Hotels & Resorts. “The reality is, people put their careers and families first. So, in their retirement era, it’s inspiring to see them live their best lives. We love that travel came up as a top priority and encourage guests to come as they are, whether they’re adventurers, foodies or just want to be taken care of.”
Along with traveling, respondents also said they’ll be side hustling (starting a small, part-time job or business) to have a little bit of extra income (78%) and to fend off boredom (45%).
And in their downtime, nearly half (43%) have or plan to pick up an old hobby. A third (33%) even said this is their time to learn a new skill.
Eleven percent are getting into sports, while others are becoming writers (17%) or learning a new language (16%) — perhaps to help make some of their travel plans easier by knowing local phrases.
While many have big travel plans and are picking up hobbies, the survey also explored who respondents might be enjoying these activities with.
Looking into their love lives, nearly one in six (15%) want to find love during retirement and are planning to spend more time dating to find “the one.”
But some single retirees are happy on their own — so when planning how to make the most of their retirement, many (16%) have boldly put a solo trip on the books.
And regardless of whether they’re going solo or have travel mates, for those with an upcoming trip, 25% plan to spend as much time as possible exploring and adventuring rather than resting and relaxing.
“One of people’s biggest fears when heading into retirement is being bored,” said Smith. “But now we’re seeing that retirees have countless ideas on how to make the most of their hard-earned time. Whether that’s traveling, starting a side hustle or picking up a hobby, retirement can be an opportunity for adventure and reinvention, and anything but boring.”
RETIREES’ TOP HOBBIES
- Gardening - 43%
- Reading - 42%
- Cooking - 38%
- Baking - 28%
- Fishing - 22%
- Painting - 17%
- Writing - 17%
- Learning a new language - 16%
- Photography - 15%
- Sewing - 14%
- Learning an instrument - 11%
- A sport - 11%
- Carpentry - 9%
- Dance - 9%
- Pickleball - 9%
- Singing - 7%
- Stand-up comedy - 2%
Survey methodology:
Talker Research surveyed 2,000 Americans who have already, or will, retire between 2020–2029; the survey was commissioned by IHG Hotels & Resorts and administered and conducted online by Talker Research between July 31 and Aug. 6, 2024.
We are sourcing from a non-probability frame and the two main sources we use are:
• Traditional online access panels — where respondents opt-in to take part in online market research for an incentive
• Programmatic — where respondents are online and are given the option to take part in a survey to receive a virtual incentive usually related to the online activity they are engaging in
Those who did not fit the specified sample were terminated from the survey. As the survey is fielded, dynamic online sampling is used, adjusting targeting to achieve the quotas specified as part of the sampling plan.
Regardless of which sources a respondent came from, they were directed to an Online Survey, where the survey was conducted in English; a link to the questionnaire can be shared upon request. Respondents were awarded points for completing the survey. These points have a small cash-equivalent monetary value.
Cells are only reported on for analysis if they have a minimum of 80 respondents, and statistical significance is calculated at the 95% level. Data is not weighted, but quotas and other parameters are put in place to reach the desired sample.
Interviews are excluded from the final analysis if they failed quality-checking measures. This includes:
• Speeders: Respondents who complete the survey in a time that is quicker than one-third of the median length of interview are disqualified as speeders
• Open ends: All verbatim responses (full open-ended questions as well as other please specify options) are checked for inappropriate or irrelevant text
• Bots: Captcha is enabled on surveys, which allows the research team to identify and disqualify bots
• Duplicates: Survey software has “deduping” based on digital fingerprinting, which ensures nobody is allowed to take the survey more than once
It is worth noting that this survey was only available to individuals with internet access, and the results may not be generalizable to those without internet access.
51
views

When is the perfect age to go on an adventure?
According to a recent survey, 42 is the perfect age to go on an adventure, with over one-third of respondents (36%) saying they’ve become more adventurous with age.
But of course, age is just a number, as the majority of respondents (83%) agreed that no matter how old you are, you can always be adventurous.
The survey of 2,000 Americans, commissioned by Storyteller Overland for American Adventures Month in August, and conducted by Talker Research, showed a quarter of Americans (27%) feel they’ve fallen into a routine rut.
One in four Americans feel their life is a bit boring, which could explain why the average respondent fantasizes about going on an adventure four times every day.
9
views

How many bad days do Americans have per month?
By 8:36 a.m., the average American knows if it’s going to be a “bad day,” according to new research.
The survey of 2,000 general population Americans revealed that not only do bad days start early in the morning — sometimes there’s no saving them.
A quarter of respondents (26%) said when something goes wrong in the morning, they can’t turn the day around.
The results also found that the average person has four bad days per month — adding up to over a full month of bad days per year (48).
Commissioned by Avocado Green Mattress and conducted by Talker Research, the survey looked not only at the timing, but it pinpointed the various causes of “bad days” for Americans.
Topping the list was waking up and feeling sick (35%), followed by sleeping poorly throughout the night (31%) or waking up with a headache (29%).
Losing their keys (26%) and forgetting their phone at home (25%) rounded out the top five ways respondents know it’ll be a bad day in the morning.
The top 10 causes of a bad day also included running out of toilet paper (22%), forgetting their wallet at home (22%) and sleeping through their alarm (19%).
That’s in addition to oversleeping (18%) or forgetting to plug their phone in the night before (18%).
And sometimes, there’s no remedy for a bad day except trying to start over: 48% of respondents admit there are times they’ve woken up feeling like it’ll be a bad day — and they’ve canceled plans or called out of work to go back to sleep.
“Bad days happen to everyone, sometimes from stress or poor sleep,” said Christine Carpio, Sr. Manager, Community + Social Impact. “By focusing on self-care and prioritizing rest, you can turn those tough days into chances for a fresh start and a brighter outlook.”
Unsurprisingly, bad days are most likely to hit at the start of the week. Thirty-six percent of respondents said Mondays are when they’re most likely to have a bad day — with Gen Z most likely to agree (50%).
This is likely due to work schedules, with the back-to-school season also a contributing factor.
The survey included almost 500 parents of school-aged children, and it asked how their child and the back-to-school season impacted their “bad days.”
Fifty-five percent said their school-aged child is more likely to have bad days at the start of the school year as they’re re-adjusting to the schedule.
But it’s not just children who see an increase in bad days: 51% of parents said they, too, have more bad days at the start of the school year.
And those often coincide — as 56% said if their child has a bad day, then they also have a bad day.
Parents or otherwise, the survey asked respondents what they do to prevent bad days from occurring.
The top three things that respondents do are: giving themselves alone time each day to relax (41%), making time each day for things they enjoy (37%) and ensuring they get enough sleep (35%).
In fact, seven in 10 respondents (71%) said how they sleep at night can be the “make or break” between a good day and a bad day.
Not only can a good night’s rest be a “make or break,” but sleeping well at night also helps 77% of respondents to be more prepared to deal with things that might go wrong in the morning.
“As we approach the busiest time of the year, from heading back-to-school and into the holiday season, slowing down where possible and prioritizing rest is a great way to prevent bad days,” said Laura Scott, Director of Brand Marketing.
WHAT ARE THE TOP 20 CAUSES OF A “BAD DAY”?
Waking up and feeling sick — 35%
Sleeping poorly throughout the night — 31%
Waking up with a headache — 29%
Losing my keys — 26%
Forgetting my phone at home — 25%
Running out of toilet paper — 22%
Forgetting my wallet at home — 22%
Sleeping through my alarm — 19%
Generally oversleeping (not waking up on time/when intended) — 18%
Having forgotten to plug my phone in the night before — 18%
Stubbing my toe — 17%
Waking up on the “wrong side of the bed” — 17%
Forgetting to set my alarm — 17%
Waking up and finding the Wi-Fi is down — 16%
My credit card is declined — 16%
My partner is in a bad mood — 15%
Running out of coffee — 15%
Spilling my coffee in the morning — 14%
Waking up to a mess from the dog/cat (poop, throw-up, etc.) — 14%
Running into traffic — 14%
Survey methodology:
Talker Research surveyed 2,000 general population Americans; the survey was commissioned by Avocado Green Mattress and administered and conducted online by Talker Research between July 23 and July 30, 2024.
We are sourcing from a non-probability frame and the two main sources we use are:
Traditional online access panels — where respondents opt-in to take part in online market research for an incentive
Programmatic — where respondents are online and are given the option to take part in a survey to receive a virtual incentive usually related to the online activity they are engaging in
Those who did not fit the specified sample were terminated from the survey. As the survey is fielded, dynamic online sampling is used, adjusting targeting to achieve the quotas specified as part of the sampling plan.
Regardless of which sources a respondent came from, they were directed to an Online Survey, where the survey was conducted in English; a link to the questionnaire can be shared upon request. Respondents were awarded points for completing the survey. These points have a small cash-equivalent monetary value.
Cells are only reported on for analysis if they have a minimum of 80 respondents, and statistical significance is calculated at the 95% level. Data is not weighted, but quotas and other parameters are put in place to reach the desired sample.
Interviews are excluded from the final analysis if they failed quality-checking measures. This includes:
Speeders: Respondents who complete the survey in a time that is quicker than one-third of the median length of interview are disqualified as speeders
Open ends: All verbatim responses (full open-ended questions as well as other please specify options) are checked for inappropriate or irrelevant text
Bots: Captcha is enabled on surveys, which allows the research team to identify and disqualify bots
Duplicates: Survey software has “deduping” based on digital fingerprinting, which ensures nobody is allowed to take the survey more than once
It is worth noting that this survey was only available to individuals with internet access, and the results may not be generalizable to those without internet access.
29
views
1
comment

America’s verdict on most disputed doggy debate
Three in four dog parents think their canine is the “main character” of their family (76%), according to new research.
A survey of 2,000 dog parents found that pups are so highly regarded, that a majority think of their dog as their child (84%).
Because of this, twice the number of respondents think of their dog before anyone else after a stressful day — even more than their partner (41% vs. 19%).
The survey also looked at the common “pet commandments” in the average household, settling some of the common doggy debates.
Conducted by Talker Research for The Pets Table, a pet food brand by HelloFresh, results showed that fur parents said it’s perfectly acceptable for dogs to be on the couch (70%) and on the bed (67%).
On the other hand, a vast majority have strong feelings against dogs at the dinner table (70%) — yet, the average dog parent feeds their dog table scraps four times a week, with one in six doing so every day.
And although most see their pets as their kids, more than half of those surveyed (56%) frowned upon the idea of using strollers for their dogs.
How do Americans feel about puppy love? The jury has spoken: most respondents said their dog is allowed to lick their face (56%), while 44% said they aren’t.
No matter what, canines come first in respondents’ households, with nearly half saying they’d rather cut some of their own expenses than those of their dogs (48% vs. 9%), particularly when it comes to going out (70%), shopping (60%) or traveling (53%).
On average, dog parents splurge on $612.10 worth of things for their dog every year; one in seven would even cross the $1,000 line on presents for their pet within a year.
The top ways respondents enjoy spoiling their dog is with premium food and treats (62%), birthday presents (40%) and clothes (21%).
Looking at whether or not pet parents have routines for feeding time or going outside, results showed that just 18% have a “strict schedule,” while 42% consider themselves as someone who goes with the flow.
Respondents are most likely to stick to a strict schedule when it comes to giving their dogs meals (62%); otherwise, they go by whenever it feels right to give them treats (65%), allow them to take a nap (83%) or go outside (62%).
Similarly, just three in 10 said their dog has an official bedtime (31%), at about 9:30 p.m. on average.
Even if they don’t have a set schedule, respondents mentioned that their dog is used to certain activities every day, like being able to go outside (73%) — specifically at about 1:36 p.m.
Dogs are also in the daily habit of having treats (65%), playtime (53%) and walks (51%).
Thirty-five percent said their dog also expects to eat a specific food every day.
"We believe that pets are part of the family and deserve to live life to the fullest,” said Dovas Zakas, co-founder and chief marketing officer of The Pets Table. “While pet parenting styles may differ between families, finding that a majority of households think of their pets as children reinforces our core values of health, quality and happiness for our pups.”
For many, it’s their dog’s way or the highway, as 40% said their pup is likely to be moody if they don’t get to do what they expect.
Punctuality is important since fur parents said that their dog would remind them to go outside (57%), eat dinner (43%) and have treats (35%) if they were behind.
While most believe they’re already doing their duty by feeding their dog a healthy diet (83%) — with the most popular pet food options being kibble (45%) or a mixed diet (29%) — one in seven notice that their dog has gained weight within the past six months.
To try something new, a quarter of respondents would be likely to shift their pup’s food to a human-grade option — especially since a majority said it’s important that their dog has the same quality of food as them (77%).
“Providing our fur babies with a wholesome, minimally-processed diet is one of the most important ways of protecting their health,” said Zakas. “Choosing healthy food for your dog is essential for their well-being. By prioritizing their diet, we not only enhance their health but also show our commitment to their happiness and longevity. After all, our pets deserve nothing but the best!"
Survey methodology:
Talker Research surveyed 2,000 dog owners; the survey was commissioned by The Pets Table and administered and conducted online by Talker Research between July 5 and July 9, 2024.
We are sourcing from a non-probability frame and the two main sources we use are:
Traditional online access panels — where respondents opt-in to take part in online market research for an incentive
Programmatic — where respondents are online and are given the option to take part in a survey to receive a virtual incentive usually related to the online activity they are engaging in
Those who did not fit the specified sample were terminated from the survey. As the survey is fielded, dynamic online sampling is used, adjusting targeting to achieve the quotas specified as part of the sampling plan.
Regardless of which sources a respondent came from, they were directed to an Online Survey, where the survey was conducted in English; a link to the questionnaire can be shared upon request. Respondents were awarded points for completing the survey. These points have a small cash-equivalent monetary value.
Cells are only reported on for analysis if they have a minimum of 80 respondents, and statistical significance is calculated at the 95% level. Data is not weighted, but quotas and other parameters are put in place to reach the desired sample.
Interviews are excluded from the final analysis if they failed quality-checking measures. This includes:
Speeders: Respondents who complete the survey in a time that is quicker than one-third of the median length of interview are disqualified as speeders
Open ends: All verbatim responses (full open-ended questions as well as other please specify options) are checked for inappropriate or irrelevant text
Bots: Captcha is enabled on surveys, which allows the research team to identify and disqualify bots
Duplicates: Survey software has “deduping” based on digital fingerprinting, which ensures nobody is allowed to take the survey more than once
It is worth noting that this survey was only available to individuals with internet access, and the results may not be generalizable to those without internet access.
23
views
1
comment