Premium Only Content
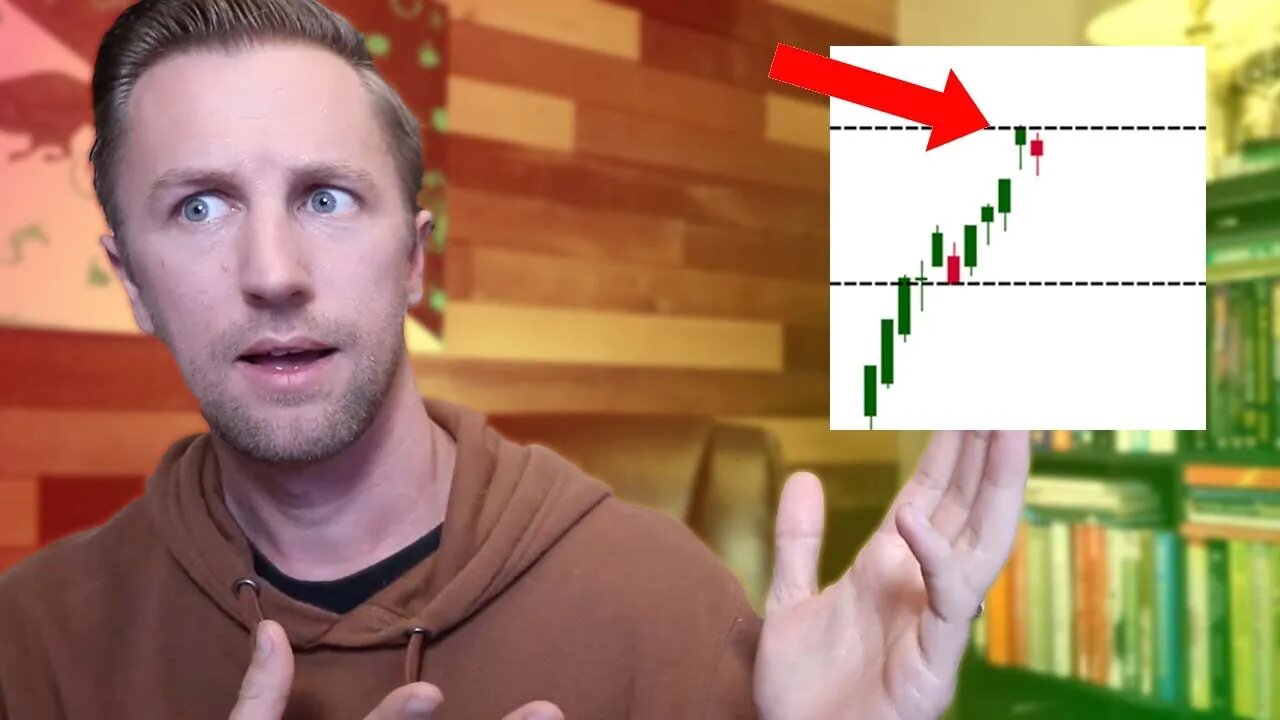
How To Predict How Far Stocks Can Go In Any Given Time | Risk Range Tutorial
🟢 TRADE IDEAS & WATCHLIST: https://www.patreon.com/figuringoutmoney
Technical Analysts use previous data to predict future price movements of stocks and index products (SPY, QQQ, IWM). The options market has great impact on the security and index products. By using implied volatility we can determine a risk range or what's known as an Expected Move.
The expected move is a calculation that I will share in this video that will give you a trading range in any given period of time that the stock market or equity will close within. There is a 68% probability of it happening and sometimes higher on big products like the SPX.
I like to look at weekly expected move to get an idea of just how volatile the next week of trading will me. If early in the week one of the levels is hit early on and is getting outside of the risk range, I will take profits, or fade the move.
In my opinion this is the best stock market indicator or tool that should be used by active traders in the market. It's a great way to help predict a stocks price= or range it will trade within.
How I Find Stock Trades:
○ Show Me The Money Scan: https://youtu.be/dzRjEuUUb5g
○ Party Starter Scan: https://youtu.be/zzaN91gcJOI
○ Bouncy Ball Scan: https://youtu.be/7xKOo6vNaq8
○ Dark Money Scan: https://youtu.be/ZUMuHaSg1ro
COME SAY HI:
Instagram: https://www.instagram.com/figuringoutmoney
Twitter: https://twitter.com/mikepsilva
DISCLAIMER: I am not a professional investment advisor, nor do I claim to be. All my videos are for entertainment and educational purposes only. This is not trading advice. I am wrong all the time. Everything you watch on my channel is my opinion. Links included in this description might be affiliate links. If you purchase a product or service with the links that I provide I may receive a small commission. There is no additional charge to you! Thank you for supporting my channel :)
-
 23:55
23:55
Figuring Out Money
1 year agoWeird Things Are Happening Right Now
60 -
 4:58
4:58
Muathe.com
3 years agoHOW TO TIME HOT MOMENTUM STOCKS Daily Examples 6/6
15 -
 5:15
5:15
Muathe.com
3 years agoHOW TO TIME HOT MOMENTUM STOCKS Daily Examples 5/6
12 -
 4:51
4:51
Muathe.com
3 years agoHOW TO TIME HOT MOMENTUM STOCKS Daily Examples 1/6
29 -
 LIVE
LIVE
RiftTV
2 hours agoFBI Director Kash Patel Sues Elijah Schaffer for $5 MILLION?!
1,022 watching -
 LIVE
LIVE
Blabs Games
9 hours agoLet's Get Those 5 Stars! Jurassic World Evolution 3 Playthrough #7
159 watching -
 50:26
50:26
BonginoReport
8 hours agoElections Post-Mortem with Mayor Scott Singer - Nightly Scroll w/ Hayley Caronia (Ep.174)
66.2K19 -
 LIVE
LIVE
XDDX_HiTower
42 minutes agoARC RAIDERS, FIRST DROP IN
40 watching -
 LIVE
LIVE
Eternal_Spartan
10 hours ago🟢 Eternal Spartan Plays Resident Evil 8 | USMC Veteran
39 watching -
 45:54
45:54
Donald Trump Jr.
5 hours agoGood Luck Chuck! The Left Lashes Out Over Shutdown Scheme's Failure | Triggered Ep.290
98.5K72