![[ FULL Sample ] Weekend Market Chart Analysis October 29 - 31, 2021](https://1a-1791.com/video/s8/1/L/n/T/F/LnTFd.qR4e-small--FULL-Sample-Weekend-Market.jpg)
[ FULL Sample ] Weekend Market Chart Analysis October 29 - 31, 2021
A 4K VERSION of this video is now available on http://www.muathe.com/
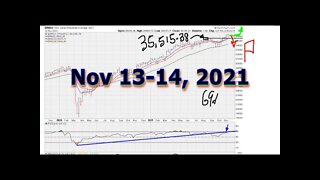
Charts mentioned include: NASDAQ weekly 15,363.52, NASDAQ 4-hourly, NASDAQ monthly 15,259.24, INDU weekly 35,515.38 / 34,200.67 and 34,777.76 plus the need to watch 33,290.08 (week of July 14th, 2021 weekly closing low) 33,271.93 (week of July 14th, 2021 intra-day lows), INDU monthly 35,360.73, INDU daily, SPX weekly 4535.43, SPX daily, SPX monthly 4,522.68, VIX monthly, TSX monthly long term KEY - 20,528.94, $TSX weekly 20,257.95, NIFTY monthly/weekly, Nifty Daily, XLE monthly, XLF monthly, TOTAL Crypto Market Cap Index monthly, weekly + 4-hourly, ETHUSD weekly and BTCUSD Weekly, and DOGEUSD monthly and weekly.
This is what paid Muathe.com clients get at least once each week plus real-time exclusive momentum breakout alerts (for U.S. stocks, ETF's and leading market-cap cryptos) and also exclusive original concepts technical analysis videos.
-
 17:56
17:56
Muathe.com
1 year ago $0.02 earned🟢 Fresh ALL TIME HIGHS Coming?! - Stocks, Crypto
194 -
![[ FULL SAMPLE ] Weekend General Market & Cryptos Chart Analysis - Dec 11-12, 2021](https://1a-1791.com/video/s8/1/b/Y/w/E/bYwEd.0kob-small--FULL-SAMPLE-Weekend-Genera.jpg) 37:42
37:42
Muathe.com
3 years ago[ FULL SAMPLE ] Weekend General Market & Cryptos Chart Analysis - Dec 11-12, 2021
40 -
![[ Part 1 ] Weekend General Market Chart Analysis - November 20 - 21, 2021](https://1a-1791.com/video/s8/1/p/c/8/E/pc8Ed.0kob-small--Part-1-Weekend-General-Mar.jpg) 27:25
27:25
Muathe.com
3 years ago[ Part 1 ] Weekend General Market Chart Analysis - November 20 - 21, 2021
7 -
![[ Part 1 ] Weekend Market & Cryptos Chart Analysis - March 19-20, 2022](https://1a-1791.com/video/s8/1/j/z/_/y/jz_yd.0kob-small--Part-1-Weekend-Market-and-.jpg) 5:24
5:24
Muathe.com
3 years ago[ Part 1 ] Weekend Market & Cryptos Chart Analysis - March 19-20, 2022
19 -
 36:04
36:04
Muathe.com
3 years agoWeekend General Market + CRYPTOS Chart Analysis - November 11 - 13, 2021
14 -
 59:46
59:46
Muathe.com
3 years agoWeekend Market Analysis June 14, 2014
16 -
 48:50
48:50
Muathe.com
3 years agoWeekend Market Analysis June 21, 2014
15 -
![Weekend Market Analysis 06/28/2014 [HD]](https://1a-1791.com/video/s8/1/9/e/d/B/9edBd.0kob-small-Weekend-Market-Analysis-062.jpg) 40:03
40:03
Muathe.com
3 years agoWeekend Market Analysis 06/28/2014 [HD]
11 -
![Weekend Market Analysis 08/16/2014 [HD]](https://1a-1791.com/video/s8/1/v/m/b/B/vmbBd.0kob-small-Weekend-Market-Analysis-081.jpg) 1:03:58
1:03:58
Muathe.com
3 years agoWeekend Market Analysis 08/16/2014 [HD]
6 -
![Weekend Market Analysis 08/09/2014 [HD]](https://1a-1791.com/video/s8/1/7/k/b/B/7kbBd.0kob-small-Weekend-Market-Analysis-080.jpg) 1:03:39
1:03:39
Muathe.com
3 years agoWeekend Market Analysis 08/09/2014 [HD]
16