After The Close Analysis 09/04/2014 [HD]
We are still observing daily chart resistance and this continues to take some time as the acceleration of the general market to upside has slowed down somewhat over the last week or so.
Only a powerful general market spike can break above the current daily chart RSI resistance.
It would make more visual sense,though, if the next actionable move in the market is lower.
I WAS WRONG on my call on commodities especially in regards to the GLD [$121.48], GDX [$24.88] and individual names SSRI [$8.03] and, SAND [$5.22].
I show that even though the main EFT commodities are down this week (including UNG [$20.89] and USO [$35.40]) their charts are NOT broken on weekly charts YET.
UNG, USO, GDX and GLD could recover week to week from current levels.
Set a stop for BBRY [$10.51] below the ideal buy price of $10.24 because it looks like the daily is signalling short-term reversal signals lower. Of course if you own it you want it to successfully defend $10.24.
-
 12:18
12:18
Muathe.com
2 years agoAfter The Close Market Analysis + Stocks To Watch 08/07/2014
5 -
 8:18
8:18
Muathe.com
2 years agoAfter The Close Market Analyis 08/25/2014
6 -
 21:34
21:34
Max Maher
2 years ago $0.01 earnedTechnical Analysis is Hard (until you see this)
231 -
 4:42
4:42
Candlestick Ninja TV
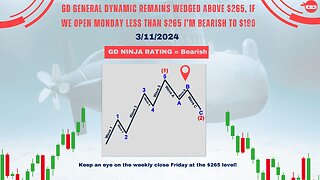
3 months agoGD General Dynamics Bearish Outlook Continues | 2/11/24 Post-Market Close Analysis
19 -
 29:48
29:48
Trading
3 years agoTechnical Analysis 12/14/20
29 -
 22:14
22:14
Hudson
11 months agoNasdaq & S&P 500 Technical Analysis: Where Do We Go From Here?
3 -
 19:55
19:55
Coin Bureau
1 year agoTechnical Analysis: Everything YOU NEED TO KNOW!! 👨🏫
251 -
 0:38
0:38
OnlyHustle
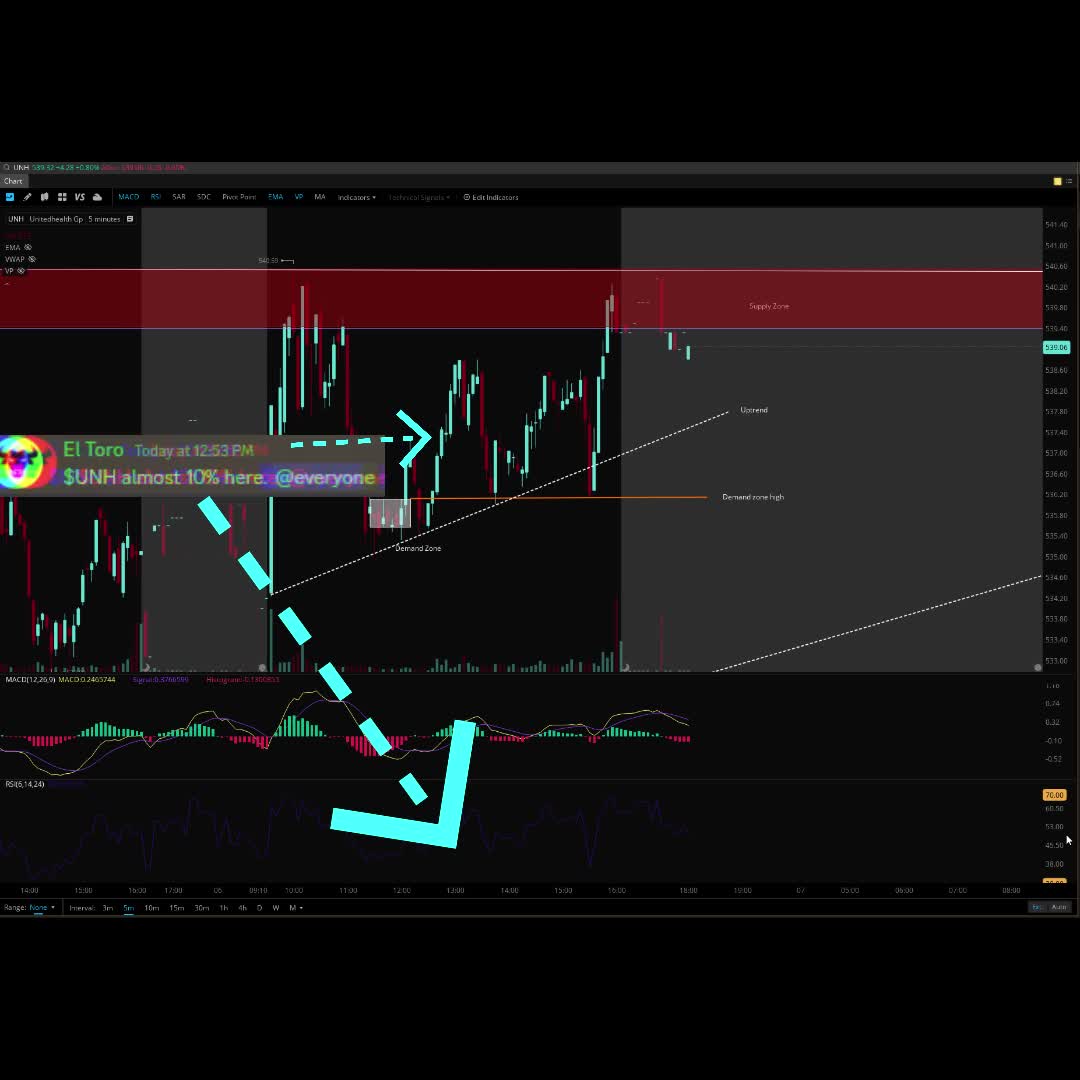
1 year ago$UNH Bullrun play - Technical Analysis -
2 -
 3:55
3:55
Petes Investing
6 months agoBITCOIN Technical Analysis Dec 06 2023
17 -
 4:00
4:00
Petes Investing
6 months agoBITCOIN Technical Analysis Dec 05 2023
22