Managing Chart Windows for Day Traders Using Multiple Markets Time Frames
Managing Chart Windows for Day Traders Using Multiple Markets and Time Frames
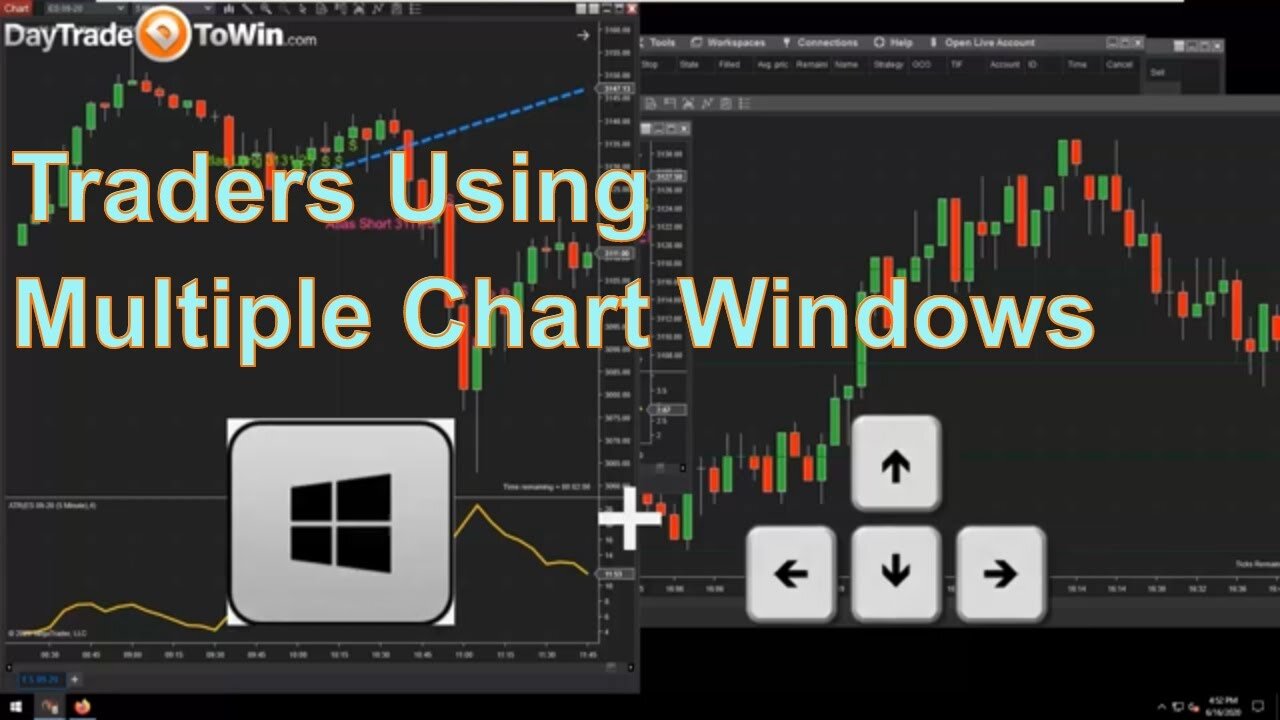
Okay. So if you've done any day trading, you've probably noticed that managing your chart windows is a bit of a pain and it certainly could be better. Windows does have a built in snapping feature where you can hold down the windows key on your keyboard and then press the left or right arrow key. And you'll get 50% coverage on the left hand side of the screen.
If you use the left arrow button. And similarly, if you click on another window here, for example, and bring the window to the foreground and use the windows key and the right arrow, you'll have it use 50% of the screen. Of course, I've already done that. So that's why that happened. This works, but it's not quite as good as some of the third party, desktop window management solutions out there. It's certainly better than using the windows task bar here at the bottom, looking at these small thumbnails and guessing which chart you want to bring to the foreground. Now, this is all a problem. That's much more common for people who use just one computer screen. So if you have multiple monitors, chances are you've saved your ideal arrangement of charts as a workspace.
There are two window managers I recommend you would probably go with one or the other. The first one is called grid move. It's free. And it's open source.
https://daytradetowin.com/get-started-trading
https://daytradetowin.com/get-started
https://daytradetowin.com/trading-systems-courses
https://daytradetowinreviews.com/
The website is: https://www.dcmembers.com/jgpaiva/
https://mizage.com/windivvy/
The second window manager is called Devi. This one is free as a trial, and then you have to pay about $14. In my experience. This one may be a little easier to use, but this certainly does the job grid move.
Once you have it configured the way you want go to work-spaces and save the workspace, save as type in a new name. If you want that's after you get everything the way you want it. My opinion, the other software is much easier to use this divvy one. And let's cover that now right away. Devi recognizes that we have a Ninja trader window in the foreground, and it's basically asking us, where do you want to put this window? It gives us a display grid. So what we can do now is click and drag within the display grid. And the chart will find itself there or whatever window I have in the foreground. So let's see which one that is. Let's click and drag from this square to the bottom. And yes, it was the chart and that's where it moved. So I have something in mind already.
Uh, normally I like to trade with the Super-dome on the right side of the screen and let's have the three charts stacked vertically. So this first chart, let's put that someplace over here. Let's go down to the windows tray, click on Devi. And since we last clicked on the chart, we can position it where we want. So let's have it cover the left side of the screen all the way up to, I would say right about there, because that gives the Super dome enough room on the right hand side. So very good. Now let's click on the Super-dome, go down here, click on Devi and select where you want it. That would be an overlap. So let's just bring it down this way here, the full length. Very good. That seems usable. Okay. Now let's load up those other charts. This is our next one. Same thing. Let's put this one below, starting here and the final chart.
I like the way everything's configured and that's a much cleaner way to use Ninja trader and certainly your indicators like we have here. Two more useful features with Ninja trader charts that you might not be aware of on the bottom of the chart window. You can see this area here to create a new tab in Ninja trader eight. Each chart can be contained in a tab instead of a floating window. So it's useful if you want to have different time-frames for the same market. For example, that's one way to think about having various tabs, or maybe you want to keep the time-frame the same, but use different instruments.
That's another option you can think of as well. So you can have a whole series of tabs going along the bottom of a chart, and that will save you from configuring multiple windows like we did today. Another thing you might not know to duplicate a chart, all you have to do is right click in the top area of the chart window and go to duplicate window. And sure enough, you have a chart with the same settings. So this is a 150 tick chart without many indicators. Let's try it with this one here. That's running the trade scalper, right? Click duplicate and yes, same thing. And it should also work for this five minute chart that's using the Atlas line. And yet those are the signals. Thanks for watching.
Price action at its best! Risk Disclosure: https://daytradetowin.com/risk
-
 LIVE
LIVE
Side Scrollers Podcast
2 hours agoVoice Actor VIRTUE SIGNAL at Award Show + Craig’s HORRIBLE Take + More | Side Scrollers
643 watching -
 1:59:21
The Charlie Kirk Show
2 hours agoCreeping Islamization + What Is An American? + AMA | Sedra, Hammer | 11.21.2025
24.7K16 -

Sean Unpaved
2 hours agoWill Caleb Williams & Bears WIN The NFC North? | UNPAVED
3.08K -
 LIVE
LIVE
Lara Logan
3 hours agoSTOLEN ELECTIONS with Gary Berntsen & Ralph Pezzullo | Ep 45 | Going Rogue with Lara Logan
413 watching -
 1:47:18
Steven Crowder
4 hours agoTo Execute or Not to Execute: Trump Flips the Dems Sedition Playbook Back at Them
246K259 -
 16:11
16:11
RealMetatron
19 hours agoHasan Piker got HUMBLED in New York
7.43K5 -
 LIVE
LIVE
Viss
3 hours ago🔴LIVE - Helping Those That Need It Today - Arc Raiders!
156 watching -
 43:37
43:37
The Rubin Report
3 hours agoTriggernometry Hosts Try to Hide Their Shock at Sam Harris’ Charlie Kirk Claim
29.7K28 -
 LIVE
LIVE
SOLTEKGG
2 hours ago🟢 Live: Pro Player Returns to Battlefield 6 RED SEC
46 watching -
 LIVE
LIVE
StevieTLIVE
3 hours agoFriday Warzone HYPE: Come Chill, Chat, and Watch Me Fry
33 watching