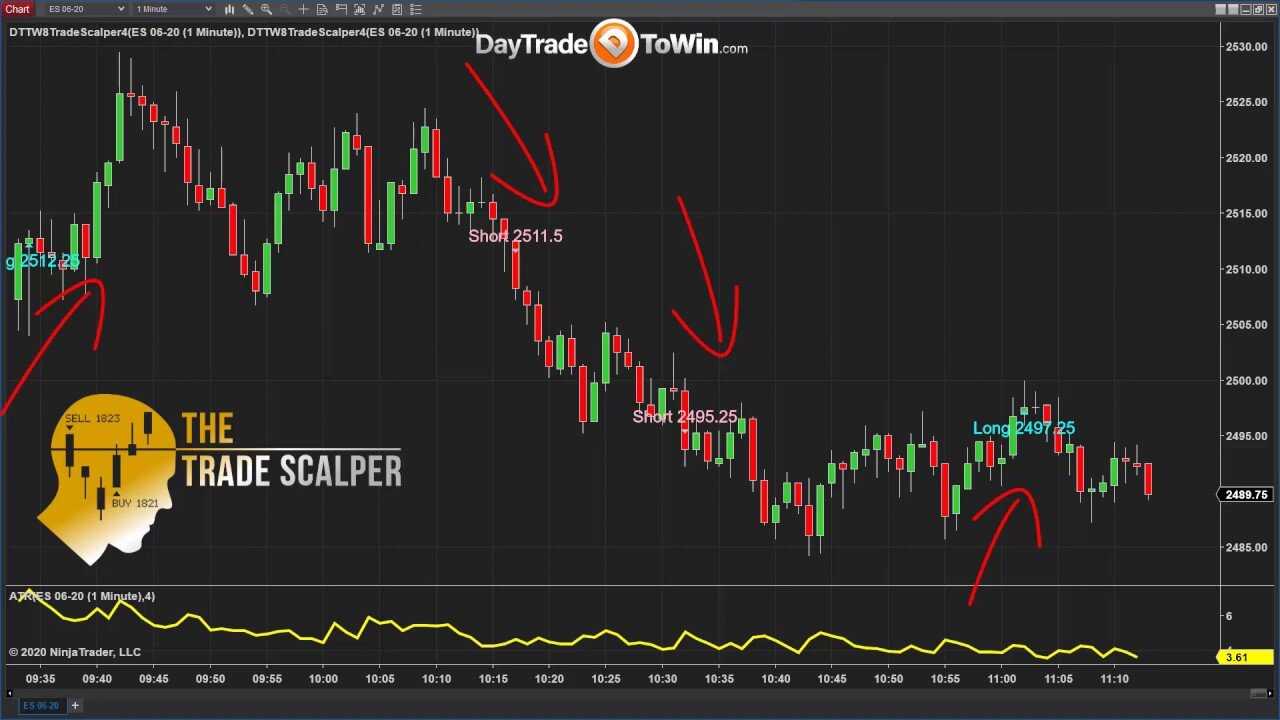
Trading Signals Using 1-Minute Candle Price Charts
It's Friday and traders should be done early.
Trading Signals Using 1-Minute Candle Price Charts sells or or buy using the Atlas Line or Trade Scalper?
The Signals will be short as the market goes lower with the Atlas Line. The goal is to use the rules as the Atlas Line and price candles begins to plot above or below.
The Trade Scalper gave many signals today, and most made the 2-point target but always use stops and targets based off the ATR. Use the Atlas Line as a filter if you choose, but not required.
So how do you scalp the markets? Watch hundred of videos online, join the family of Trade Scalper traders and get into the action for stocks, indices, currencies or any market you prefer. Just remember to use the ATR for clarification as taught in the course.
https://daytradetowin.com/blog/ for more info and opportunities to become a daytrader.
https://daytradetowin.com/futures-trading.php
https://daytradetowin.com/learn-day-trading.php
https://daytradetowin.com/price-action-trading.php
Price action at its best! Risk Disclosure: https://daytradetowin.com/risk
-
 23:47
23:47
GritsGG
2 days agoThe Forgotten Best Sniper Support AR!
24.7K4 -
 10:18
10:18
The Pascal Show
16 hours ago'I WILL NOT GIVE UP ON MY BABY!' Emmanuel Haro's Mom Breaks Silence From Jail?!
1.63K -
 LIVE
LIVE
Lofi Girl
2 years agoSynthwave Radio 🌌 - beats to chill/game to
145 watching -
 2:33:04
Badlands Media
13 hours agoBaseless Conspiracies Ep. 147: Pole Shifts, Plasma Skies, and the Truth About Cataclysms
166K17 -
 4:33:42
Drew Hernandez
9 hours agoISRAEL BOMBS GAZA HOSPITAL ON LIVE TV KILLING AT LEAST 20 INCLUDING JOURNALISTS & CIVILIANS
20.8K67 -
 2:55:23
TimcastIRL
8 hours agoTrump Orders Specialized National Guard Units To Combat Crime In Cities, Dems Furious | Timcast IRL
205K146 -
 6:22:03
SpartakusLIVE
10 hours ago#1 Rocket CHAMPION of Verdansk wields UNSTOPPABLE new META
81.3K5 -
 2:55:11
Barry Cunningham
10 hours agoPRESIDENT TRUMP MADE TODAY A VERY BAD DAY TO BE A DEMOCRAT!
100K66 -
 1:15:29
Flyover Conservatives
1 day agoFrom Cool to Cringe: How Democrats Lost America’s Ear | FOC Show
48.1K14 -
 8:19
8:19
MattMorseTV
13 hours ago $8.93 earnedTrump is ACTUALLY DOING IT.
48.5K43