How to Make a Football Field Chart in Excel
3 years ago
13
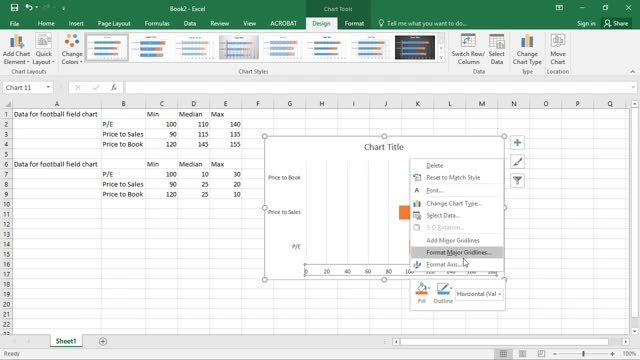
A football field chart is a really nice way to visually display a range of valuations for a company or investment opportunity. It is super useful to demonstrating consistency in valuation methods and that you’ve thought about how sensitive your valuation is to different assumptions (i.e., a sensitivity analysis). Unfortunately, putting together a football field chart is kind of tricky. This video is a super basic example of how to get started making a football field chart. The final chart is not formatted well, but the point is just to give you a jumping off point to making a proper football field chart.
Loading comments...
-
 1:36
1:36
From Zero → Viral with AI
1 day agoAI in Content Creation & Discovery – The New Era of Marketing
1.3K -
 1:20:10
FreshandFit
11 hours agoMiami Halloween Street Debate
204K100 -
 2:06:16
TimcastIRL
14 hours agoTrump Calls For NUCLEAR OPTION, END Filibuster Over Food Stamp Crisis | Timcast IRL
216K177 -
 3:58:54
SavageJayGatsby
12 hours ago🎃 Friend Friday – Halloween Edition! 👻🕷️
52.1K4 -
 16:16
16:16
Robbi On The Record
12 days ago $22.02 earnedThe Dark History of Halloween | What You Should Know
69.4K70 -
 58:18
58:18
Flyover Conservatives
1 day agoThe Truth About Halloween that You DIDN’T Know - Holiday Special - Historian Bill Federer | FOC SPECIAL Show
65.6K11 -
 3:10:46
Ellie_roe
11 hours agoEllie and Errys Halloween Spooktacular || Random Horror Games
33.6K7 -
 50:27
50:27
Sarah Westall
12 hours agoBig Banks Caught Rigging Market, IMF tells World to “Buckle Up” w/ Andy Schectman
56.8K27 -
 13:54
13:54
Degenerate Jay
19 hours ago $3.71 earned5 Best Superhero Movies To Watch On Halloween
31.4K11 -
 59:03
59:03
NAG Podcast
12 hours agoSarah Fields: BOLDTALK W/Angela Belcamino
54.4K19