The 7 Day Cycle of Deaths | Craig Paardekooper
DESCRIPTION BY CRAIG PAARDEKOOPER
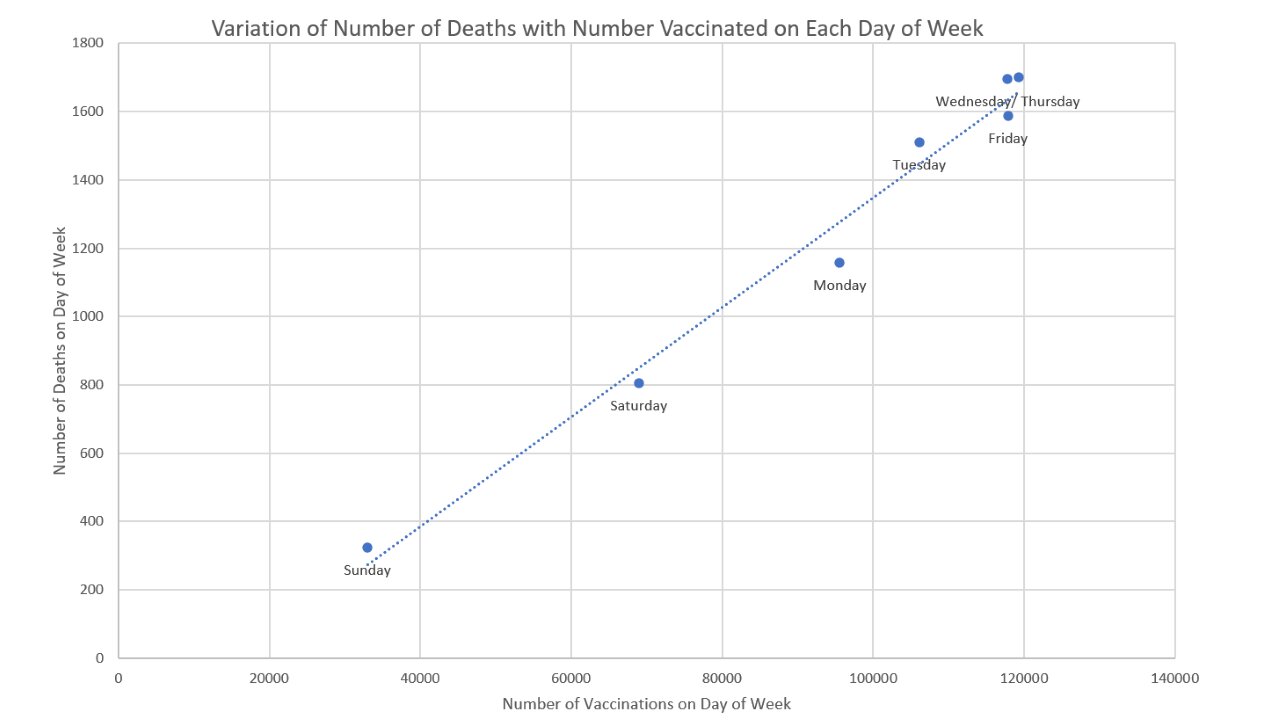
I counted the number of vaccinations on each day as recorded by the vaccination date in VAERS 2021. I found that each week there is a repeating pattern for the number vaccinated.
It is always lowest on Sunday. Then climbs on Monday, Tuesday and Wednesday to a peak on Thursday. Then declines on Friday and Saturday back to the lowest point on Sunday.
I then looked at deaths, to see if these followed the same pattern. They did exactly (correlation 0.99 , p=0.046)
So there is a weekly cycle of deaths that mirrors the weekly cycle of numbers vaccinated. I have posted all the information here https://howbad.info/sizematters.html
My findings agree with the patterns of data collected by Jason Morpett. Jason counted number of vaccinated each day based on the figures released by the CDC for daily vaccination numbers. Then he divided number of deaths recorded in VAERS for each day, by the total by the total number vaccinated on that day. The result was an oscillating graph with a minimum every 7 days - and with a peak every 7 days.
I asked Jason to produce a graph for just death alone, to see if deaths oscillated too. And we found that they did so consistently across the whole of 2021, with a minimum always falling on a Sunday.
So, there is a weekly cycle in the numbers dying after vaccination, and this has a 0.99 correlation with the numbers injected - with the numbers dying on each day of the week reflected in the number vaccinated on each day.
-
 2:05:07
Darkhorse Podcast
5 hours agoWhy Trump Wants Greenland: The 257th Evolutionary Lens with Bret Weinstein and Heather Heying
39K89 -
 LIVE
LIVE
Right Side Broadcasting Network
5 hours ago🎅 LIVE: Tracking Santa on Christmas Eve 2024 NORAD Santa Tracker 🎅
1,765 watching -
 2:48
2:48
Steven Crowder
8 hours agoCROWDER CLASSICS: What’s This? | Nightmare Before Kwanzaa (Nightmare Before Christmas Parody)
159K11 -
 LIVE
LIVE
LFA TV
9 hours agoLFA TV CHRISTMAS EVE REPLAY
761 watching -
![ROSEANNE BARR - Her Journey, TRUMP, and the MAGA GOLDEN AGE! [INTERVIEW]](https://1a-1791.com/video/s8/1/M/m/B/2/MmB2v.0kob.1-small-ROSEANNE-BARR-Her-Journey-T.jpg) 51:35
51:35
Dr Steve Turley
1 day ago $9.18 earnedROSEANNE BARR - Her Journey, TRUMP, and the MAGA GOLDEN AGE! [INTERVIEW]
21.6K34 -
 57:38
57:38
The Tom Renz Show
2 hours agoMerry Christmas - The Tom Renz Show Christmas
17.6K1 -
 2:59:10
Wendy Bell Radio
13 hours agoThe Bridge Too Far
117K143 -
 1:03:45
Donald Trump Jr.
1 day agoHappy Festivus: Airing Our Grievances and Stopping The Swamp w/Sean Davis | TRIGGERED Ep.201
391K519 -
 1:30:30
Game On!
16 hours ago $7.08 earnedTop 5 things you need to know for Sports Christmas!
50K3 -
 1:58:10
Robert Gouveia
1 day agoMatt Gaetz REJECTS Report, Sues Committee; Luigi Fan Club Arrives; Biden Commutes; Festivus Waste
276K210