RSI Technical Analysis
RSI or Relative Strength Index helps to identify if a stock is overbought or oversold on a technical basis using prior data periods. In this video, I outline how I change from the normal 14-period RSI and actually use two other periods, one for investing/swing trading and the other for day trading.
Below are links for the images I took of SNAP's charts using the different RSI periods for comparison and the ranges I use for them in trading.
https://drive.google.com/drive/folders/16m_l5fypCXU5d8VMUCq3A2Sxv_vgY8mR?usp=sharing
0:00 - RSI & Periods I Use
0:50 - 1:40 Daily Chart - Investing/Swing Trading
1:40 - 2:01 Trading The Same Stock Repeatedly
2:01 - 2:41 5 Min. Chart - Day Trading
2:41 - 3:17 RSI Is #3
***Disclaimer: This is for educational purposes containing my personal opinions and approaches, this is not investment advice. All trades are made in my smaller accounts to accommodate reasonable expectations for beginning traders with smaller accounts.***
Earn Free Stock(s)!
https://act.webull.com/pr/DZ4FCpnQQDua/ar5/inviteUs/main
https://join.robinhood.com/morganm13
https://voyager.onelink.me/WNly/referral?af_sub5=MORD20990
https://www.coinbase.com/join/mcdona_06i
https://minepi.com/makuattaku12
TubeBuddy: https://www.tubebuddy.com/LynchPinTrading
#stocks #stockmarket #rsi #technicalanalysis #technicalindicators #overbought #oversold #relativestrengthindex #investing #daytrading #options #optionstrader #optionstrading #swingtrading #daytrader #money #makingmoney #investingforbeginners #tdameritrade #thinkorswim #robinhood #webull #fidelity #beststockapps #howto #tutorial #buildingwealth #swingtrader
-
 8:29
8:29
Ultimate Trader
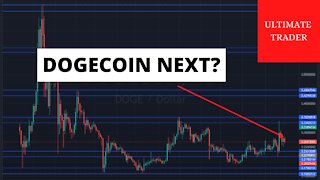
2 years ago $0.01 earnedDogecoin Technical Analysis
49 -
 5:54
5:54
Ultimate Trader
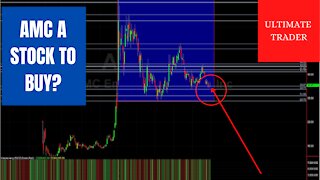
2 years agoAMC Stock Technical Analysis
411 -
 5:21
5:21
Ultimate Trader
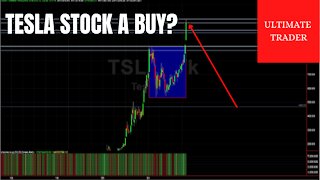
2 years ago $0.02 earnedTesla Stock Technical Analysis
66 -
 6:27
6:27
Ultimate Trader
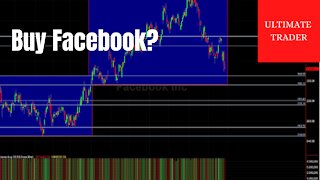
2 years agoFacebook Stock Technical Analysis
791 -
 7:29
7:29
Ultimate Trader
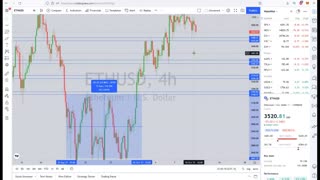
2 years agoEthereum ETH Technical Analysis Crypto
67 -
 4:21
4:21
Ultimate Trader
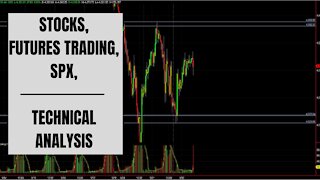
2 years agoStocks | Futures Trading | SPX | Technical Analysis
86 -
 2:54
2:54
StockGraph
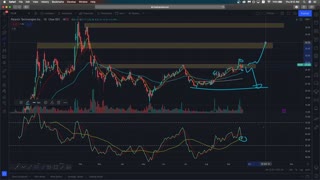
2 years agoPalantir Price Prediction END 2021 // Technical Analysis
70 -
 3:19
3:19
Ultimate Trader
2 years ago $0.01 earnedBitcoin Today: A Quick Bitcoin Technical Analysis
52 -
 10:51
10:51
Ultimate Trader
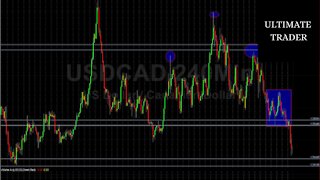
2 years agoForex Trading Technical Analysis - Forex Signals
802 -
 1:12
1:12
The Teen Investor
3 years agoTechnical Vs Fundamental Analysis!
31