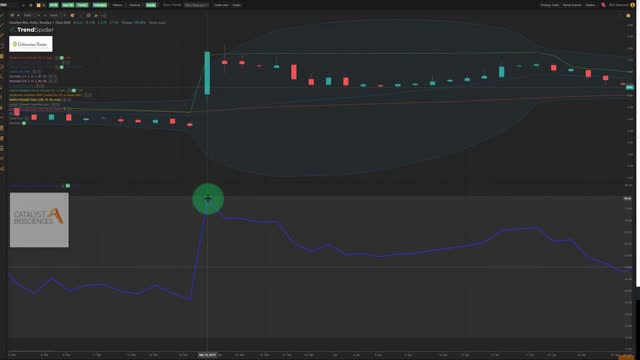
RSI Trading Strategy | RSI Divergence Explained | RSI Candlestick Chart Technical Analysis
New Relative Strength Indicator Strategy Lessons for 2022. Tutorial for RSI Divergence for beginners. Advanced Contrarian Trading tutorials for RSI Day traders and Swing Traders.
Here’s what you’ll learn:
* What is the RSI and how you can harness the power of identifying RSI divergences.
*For beginners you will learn the basics of the RSI and how Getting Started In Technical Analysis, Technical Analysis for Dummies are out of date. We will replace myths and replace them with new tactics for the 21st Century
* How can the Relative Strength Indicator or Relative Strength Index help you spot "Extreme| and "Unsustainable" overbought and oversold swing trade and day trade opportunities.
*Learn how to use RSI as a leading indicator in conjunction with other leading indicators such as the Bollinger Bands, price, volume and lagging indicators such as MACD and the moving averages.
*Learn the power of the Bollinger Band Strategy in conjunction with the RSI.
*Learn how TrendSpider can be modified to allow for a customized RSI giving you an edge over other traders.
*Learn how to calculate RSI to ensure the best risk-reward entry points for each stock, commodity, forex or crypto trade you make using the Relative Strength Indicator as a part of your overall investment strategy.
*RSI basics for those who want to learn how to trade or great for stock market for beginners
-
If you are interested in automating your trading routine/system, we recommend this Software Which Identifies Historical Seasonal Trends And Market Cycles.
This is Software that we trust.
GET IT HERE ▶▶▶ https://bit.ly/31MqVJG ◀◀◀
-
 LIVE
LIVE
Glenn Greenwald
1 hour agoTrump and Rubio Apply Panama Regime Change Playbook to Venezuela; Michael Tracey is Kicked-Out of Epstein Press Conference; RFK Senate Hearing | SYSTEM UPDATE #508
12,388 watching -
 LIVE
LIVE
MattMorseTV
1 hour ago🔴Trump just SHATTERED the RECORD.🔴
667 watching -
 1:05:11
Donald Trump Jr.
2 hours agoBuilding the Future with American Bitcoin, Plus Eric's Triggered Debut! | TRIGGERED Ep.272
78.4K50 -
 1:01:40
The Nick DiPaolo Show Channel
4 hours agoTrump Waiting On Tariff Ruling | The Nick Di Paolo Show #1788
13.7K17 -
 1:23:59
Dr. Drew
8 hours agoSalty Cracker: Dr. Drew's Birthday, Sydney Sweeney's Jeans, Rosie's Apology To MAGA & More News From Our Clown World – Ask Dr. Drew
94.1K38 -
 LIVE
LIVE
Rallied
1 hour ago $0.46 earnedWarzone Solo Challenges
97 watching -
 1:04:40
BonginoReport
2 hours agoMAHA Madness: RFK Jr. vs Newsom - Nightly Scroll w/ Hayley Caronia (Ep.127) - 09/04/2025
36.6K15 -
 1:58:36
Redacted News
4 hours agoUkraine bans Christians, Trump Sends Troops to Chicago, German AFD members being murdered | Redacted
112K89 -
 1:17:43
Michael Franzese
2 hours agoMy Daughters CONFRONTED Me About Being a Mobster Dad
28.2K2 -
 24:02
24:02
Kimberly Guilfoyle
5 hours agoCartel Strikes: Breaking News Coverage! | Ep.251
30.4K11