The Bump And Run - The Ultimate Chart Analysis Course
2 years ago
24
Enroll in the full course here: https://www.udemy.com/course/tsaultimatechartanalysis/?referralCode=B3A9AFA5A79307F392B0
This is a free preview of The Ultimate Chart Analysis Course. Want more free exclusive content? Sign Up Here: ExclusiveTSA.tk
Loading comments...
-
 1:18
1:18
Ascencore
5 months agoHow To Use The Coppock Curve Indicator, Casey`s General Stores (CASY) Stock Chart Analysis Example
3 -
 0:58
0:58
Ascencore
5 months agoChart Analysis With The Chande Kroll Stop indicator
-
 5:35
5:35
Ascencore
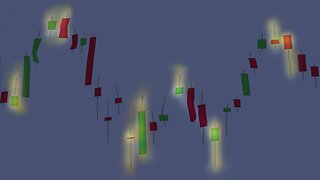
5 months agoStock Chart Technical Analysis (Bull Hammer) Candlestick Chart Pattern Analysis
10 -
 1:54
1:54
Ascencore
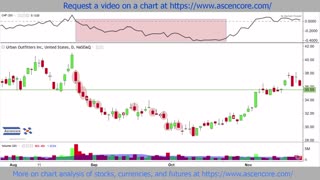
5 months agoUrban Outfitters (URBN) Stock Chart Analysis With The Chaikin Money Flow Indicator
10 -
 7:37
7:37
Ascencore
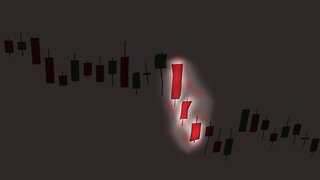
5 months agoStock Chart Technical Analysis (3 Black Crows) Candlestick Chart Pattern Analysis
23 -
 6:26
6:26
Ascencore
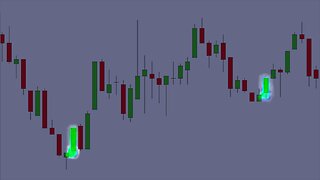
5 months agoStock Chart Technical Analysis (Inverted Hammer) Candlestick Chart Pattern Analysis
1 -
 1:17
1:17
Ascencore
5 months agoStock Chart Technical Analysis With Candlestick Chart Pattern (Explained Using Real Examples)
12 -
 4:05
4:05
Ascencore
5 months agoStock Chart Technical Analysis (Bullish KickerKicking) Candlestick Chart Pattern Analysis
15 -
 1:35
1:35
Ascencore
5 months agoHow To Draw A Fibonacci Channel WTI Crude Oil Chart Analysis Example
17 -
 2:58
2:58
Ascencore
5 months agoStock Chart Technical Analysis (3 Methods Rising) Candlestick Chart Pattern Analysis
31