Premium Only Content

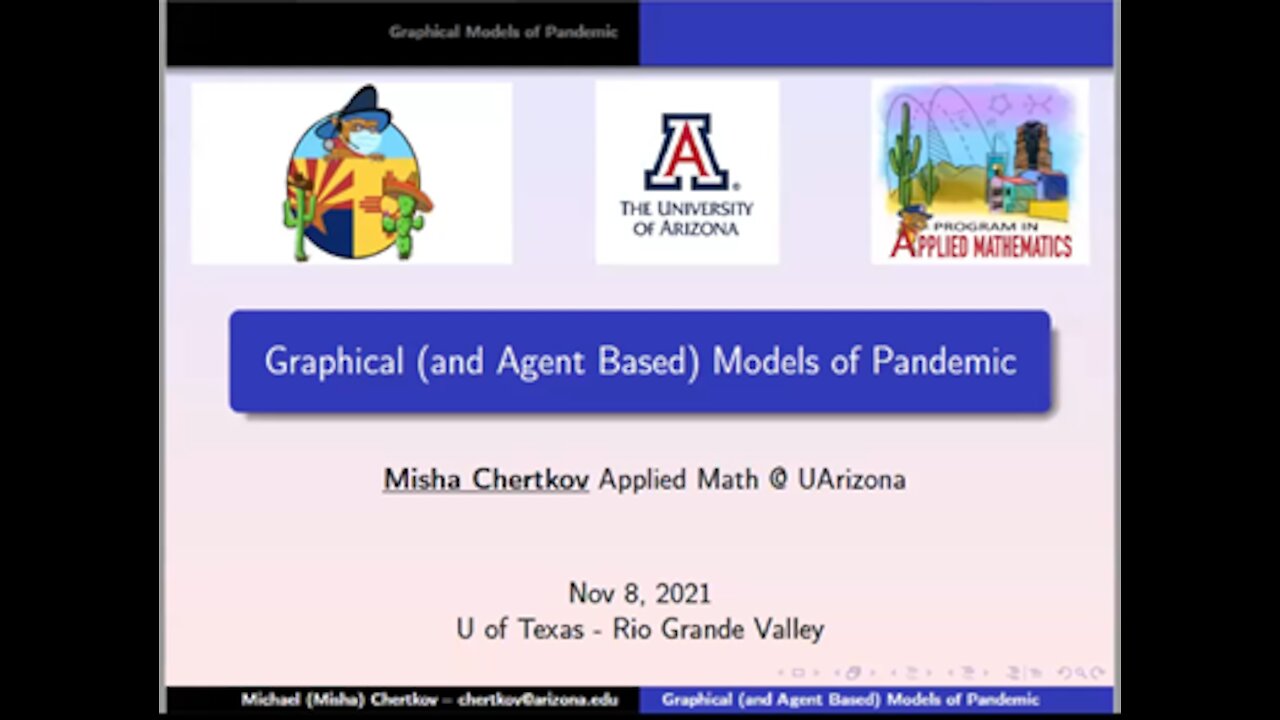
Graphical Models of Pandemic
Abstract
Both COVID-19 and novel pandemics challenge those of us within the modeling commu- nity, specifically in establishing suitable relations between lifecycles, scales, and existing methods. Herein we demonstrate transitions between models in space/time, individual- to-community, county-to-city, along with models for the trace beginning with exposure, then to symptom manifest, then to community transmission. To that end, we leverage
publicly available data to compose a chain of Graphical Models (GMs) for predicting in- fection rates across communities, space, and time. We'll anchor our GMs against the more expensive yet state-of-the-art Agent-Based Models (ABMs).
About the Speaker
Michael Chertkov is a Professor of Mathematics (main appoint- ment), Chair of the Graduate Interdisciplinary Program (GIDP) in Applied Mathematics, member of GIDP in Statistics and Data Sci- ence, and professor of Computer Science (courtesy appointment) at the UArizona. His area of focus is on integration of data science disciplines (e.g. machine learning and AI) into applied mathematics to resolve challenges in natural sciences and engineering.
Dr. Chertkov received his Ph.D. in physics from the Weizmann Institute of Science in 1996, spent three years at Princeton University as a R.H. Dicke Fellow in the Department of Phys- ics, and joined Los Alamos NL in 1999, initially as a J.R. Oppenheimer Fellow and then as a Technical Staff Member. During his 20 years at LANL he led multiple DOE and DTRA pro- jects, in particular on "physics of algorithms", "optimization, inference and learning of en- ergy systems" and "machine learning for turbulence". Dr. Chertkov has moved to Tucson in 2019. He has published more than 230 papers, is a fellow of the American Physical Society and a senior member of IEEE.
-
 8:39
8:39
MetatronHistory
1 day agoWhy Did We Switch From Bronze to Iron in Classical Antiquity?
4.21K -
 11:01
11:01
MattMorseTV
14 hours ago $10.07 earnedEU caught in $140,000,000 SCANDAL.
14.2K48 -
 1:44:46
PandaSub2000
10 hours agoUltimate Chicken Horse | ULTRA BEST AT GAMES (HD Edited Replay)
4.66K -
 1:47:16
omarelattar
2 days agoTroy Eckard Shares His Rags to Riches Story
6.4K -
 26:18
26:18
GritsGG
14 hours agoHow to Activate Heat Map & Find Self Revives On Warzone!
4.79K -
 29:01
29:01
The Pascal Show
1 day ago $8.54 earnedRUNNING SCARED! Candace Owens DESTROYS TPUSA! Are They Backing Out?!
39.6K49 -
 24:45
24:45
Blabbering Collector
1 day agoUnboxing The 2025 Diagon Alley Advent Calendar By Carat Shop | Harry Potter
5.77K -
 0:43
0:43
Gaming on Rumble
1 day ago $5.65 earnedLvl UP (Raids)
38.9K2 -
 19:07
19:07
MetatronGaming
1 day agoWe need to find a way out NOW!
5.88K -
 1:11:16
omarelattar
4 days agoHow I Went From Depressed w/ $0 To $500 Million Per Year In My 20's (COMFRT CEO Hudson Leogrande)
6.5K