Premium Only Content

Node-RED User Interface - Dashboards
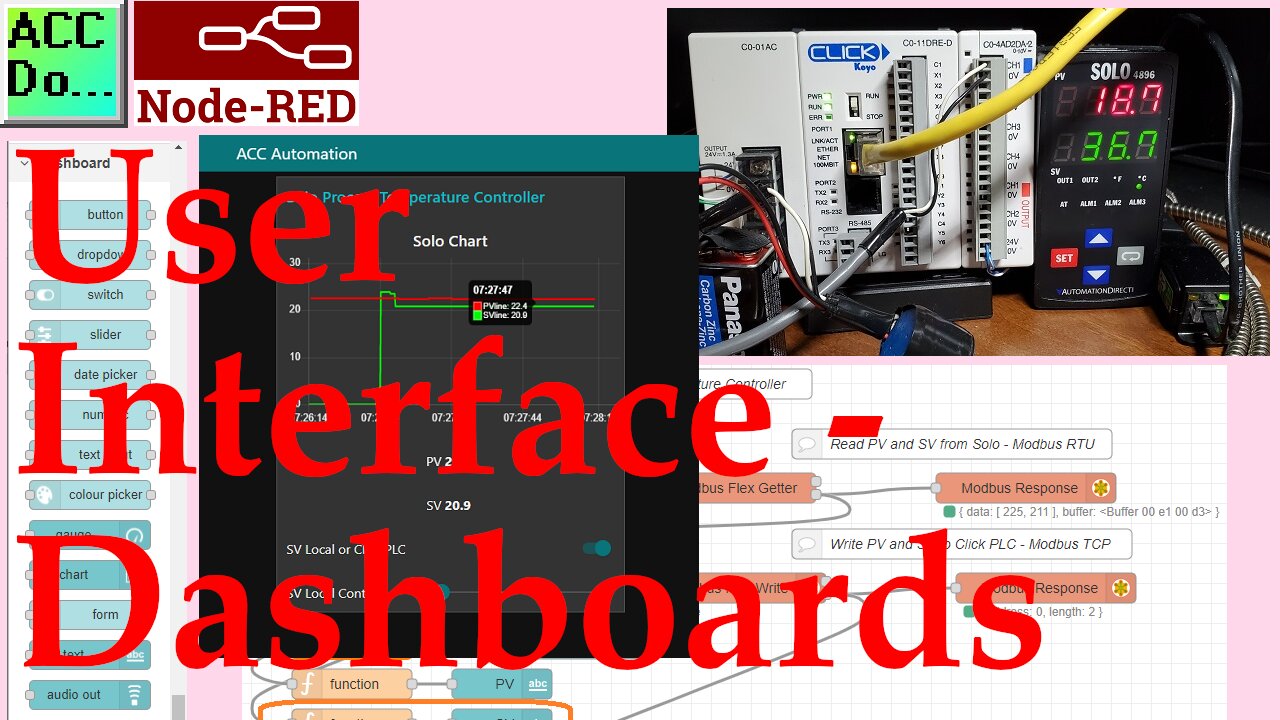
Node-RED can easily display interactive information to the user or operator using a web browser on your phone, tablet, or computer. Any device that has access to the network in which node-red is running.
We will be installing the node-red-dashboard palette. This allows us to create a live data dashboard user interface. (UI) The information from our Solo process temperature controller will be displayed. Setpoint information can be set either by the dashboard UI or the Click analog input signal. This will be selected via the user interface. Let’s get started using Node-RED Dashboards.
Additional links and information in the video can be obtained from our website post:
https://accautomation.ca/node-red-user-interface-dashboards/
There are several reasons why we are using Node-RED. Here are just a few.
- Built on top of the most dependable programming language JavaScript.
- JavaScript is flexible and easy to work with on web browsers, server-side, IoT, IIoT projects, and more.
- Visual flow type interface making programming easy.
- Node will allow JavaScript code to run directly on a computer.
- Node-RED is a free, open-source logic engine.
- Connect to PLC, PAC, Temperature Controllers, Process Controllers using standard protocols.
- Save and read from databases
- Easily make the Internet of Things (IoT, IIoT) industrial solutions.
Node-RED provides the ability for you to quickly create custom control solutions.
-
 LIVE
LIVE
Kim Iversen
3 hours agoEvacuating My Christian Family from Al-Qaeda-Controlled Syria: Kevork Almassian | Trump To End Birthright Citizenship? Jamarl Thomas
2,913 watching -
 DVR
DVR
Stephen Gardner
1 hour ago🔴JUST IN: DA Alvin Braggs THREATENS Trump | Canada Justin Trudeau OFFENDS Americans!
2.28K33 -
 LIVE
LIVE
Barry Cunningham
2 hours agoThe Evening News: Chris Wray Resignation Has Media In FREAKOUY Mode!
1,727 watching -
 LIVE
LIVE
The Jimmy Dore Show
3 hours agoJeffrey Sachs: The US Is Netanyahu’s Puppet! Here’s How War w/ Iran Will Start! w/ Omali Yeshitela
15,651 watching -
![GrayZone Warfare: NightOp [GAME GIVEAWAY!] - #RumbleGaming](https://1a-1791.com/video/s8/1/s/1/R/D/s1RDv.0kob-small-GrayZone-Warfare-NightOp-GA.jpg) LIVE
LIVE
LumpyPotatoX2
2 hours agoGrayZone Warfare: NightOp [GAME GIVEAWAY!] - #RumbleGaming
477 watching -
 2:25:44
WeAreChange
3 hours agoAliens?! Pentagon Shoots Down Iranian Mothership Drone Narrative
42K13 -

The StoneZONE with Roger Stone
2 hours agoShould the January 6th Committee be Investigated? | The StoneZONE w/ Roger Stone
8.68K1 -
 44:34
44:34
PMG
2 hours ago $0.51 earned"Caitlin Clark Says She Has “White Privilege” Why Caitlin WHY???"
5.77K1 -
 1:06:50
Dr. Drew
9 hours agoRoger Ver, Jan 6ers, Ross Ulbricht: Who Should Trump Pardon First? w/ Robert Barnes & Aaron Day – Ask Dr. Drew
31.5K3 -
 11:56
11:56
Tundra Tactical
3 hours ago $1.38 earnedWas the UnitedHealthcare CEO Assassination a PSYOP?
12.1K4