HIGHER Timeframe Trend is Your Friend - Profitable Trading System
https://traderslanding.net
The Chop Zone indicator attempts to determine if a market is trending or consolidating. This study is based on the Choppiness Index created by Australian commodities trader E.W. "Bill" Dreiss.
I deploy the Chop Zone as a key component of a complete trading system that has been proven profitable over a series of 100 trades. In addition, I review the equity curve, provide a Trader's Landing Score, and share my 6 optimization tips that you can try in your own testing.
🔔 SUBSCRIBE NOW: https://bit.ly/SubTL
🐦 TWITTER: https://bit.ly/TLTweet
✨ A Playlist of Systems I Like: https://bit.ly/SystemsILike
🏠 System Web page: https://traderslanding.net/2021/12/04/52/
🔍 Link to my Testing Performance Spreadsheet: https://traderslanding.net/results/
📘 Link to my free backtesting spreadsheet: https://traderslanding.net/2021/08/15/26/
⏱️ Timestamps ⏱️
00:00 - Start
00:44 - Indicators
02:30 - Long Examples
04:08 - Short Examples
06:00 - Testing Results & Equity Curve
07:15 - Trader’s Landing Score
00:00 - Optimization
⚙️ System Specifics ⚙️
📛 System Name: Chopping Broccoli
🏆 Trader’s Landing Score: 7
🎹 Instrument: Binance Coin / Bitcoin (BNB/BTC)
⌛ Time Frame: 1-Hour (H1)
👀 TradingView Indicators
Name: Exponential Moving Average (EMA)
Inputs: Length = 200
Style: White
By: TradingView Built-In
Link: https://www.tradingview.com/support/solutions/43000592270-exponential-moving-average/
Name: Stochastic RSI
Inputs: Default
Style: Thicker lines.
By: TradingView Built-In
Link: https://www.tradingview.com/support/solutions/43000502333-stochastic-rsi-stoch-rsi/
Name: Chop Zone
Inputs: Timeframe = 4 Hours, Gaps = Checked
Style: Colors 1, 2, 3, 5, 6, 7, 8 = Yellow; Color 0 = Cyan; Color 4 = Pink
By: TradingView Built-In
Link: https://www.tradingview.com/support/solutions/43000589111-chop-zone/
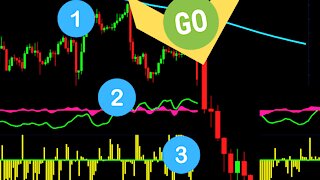
☝️ Long Entry
1. Price above the 200 EMA.
2. Chop Zone indicator is cyan for the previous 3 bars.
3. Stochastic RSI closes in the oversold zone.
4. Stochastic RSI closes crossing up.
👇 Short Entry
1. Price below the 200 EMA.
2. Chop Zone indicator is pink for the previous 3 bars.
3. Stochastic RSI closes in the overbought zone.
4. Stochastic RSI closes crossing down.
🔥 Risk to Reward: 1:2
🛑 Where to place stop-loss:
For Longs: Previous swing low.
For Shorts: Previous swing high.
🚀 Where to take profits: 1:2
______
Metatags
#ChopZone #ChoppinessIndex #BinanceCoin #Bitcoin #StrategyReview #TradingSystem
Attribution
Skateboarder clip licensed under creative commons license:
Instant Regret-Try Not To Laugh|Funny Fails Compilation #4
https://www.youtube.com/watch?v=Piso9_hFbOA
⚠️Disclaimer: This content references opinion and is for information purposes only. Not intended to be investment advice.
-
 5:47
5:47
Trader's Landing
2 days ago $0.07 earnedJack Makes Me Money - Expert Gold Trader
5211 -
 8:59
8:59
Trader's Landing
2 years ago $0.20 earnedEasy, Simple, Profitable - Complete Trading System
8816 -
 4:59
4:59
Trader's Landing
2 years agoRevamp: Turtle Trading System
311 -
 11:40
11:40
Petes Investing
2 years agoCompare Bluechip timeframe trading results.
350 -
 2:52
2:52
Online Trading AUTHORITY
2 years agoIntroducing Cyclone CORE Options Trading System
52 -
 6:11
6:11
Trader's Landing
2 years agoSwing Trading - Wave Trend + Force Index
4811 -
 3:55
3:55
Trader's Landing
2 years ago $0.05 earnedSwing Trading - Wave Trend + Force Index
245 -
 8:33
8:33
Trader's Landing
2 years ago $0.62 earnedDarvas Box Trading System - Tested 100 Times
2.42K298 -
 7:11
7:11
Trader's Landing
2 years agoBeginner Trading System | Custom Indicators | Forex Factory
146 -
 7:16
7:16
Trader's Landing
2 years agoAMAZING - No Indicator Complete Trading System - HOLO
1032