WOW! Triple SuperTrend w/ Volume Strategy
Website: https://traderslanding.net
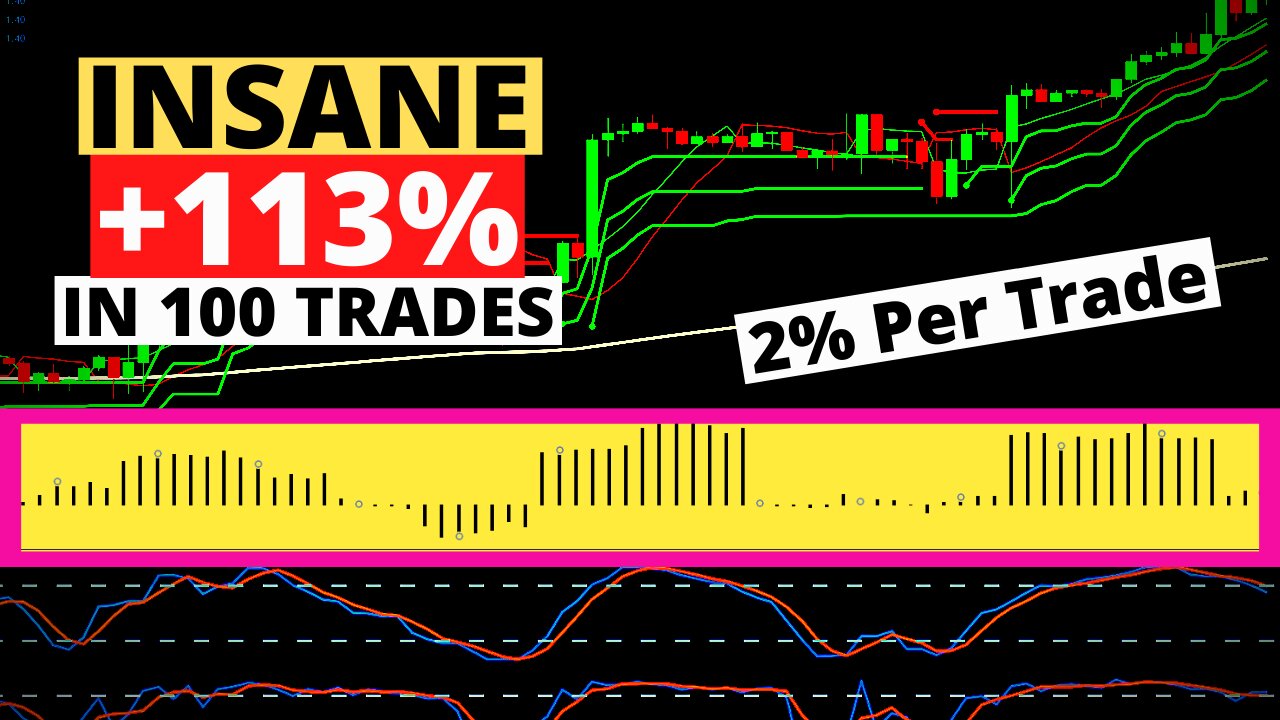
I take the Triple SuperTrend from TradePro and combine it with a volume indicator I saw on the Secret Mindset to create a very profitable system with fantastic potential. This test was only 100 trades on Euro vs. the US Dollar but I suspect this will have similar performance in the crypto markets. As I always say you need to really test this to optimize it and be comfortable with the expected results.
🔔 SUBSCRIBE NOW for more content like this: https://bit.ly/SubTL
🐦 TWITTER - Check out Twitter for current setups in the market as I see it: https://bit.ly/TLTweet
By testing indicator based trading strategies we are able to learn and understand a system’s performance by using a repeatable and clearly defined trading criteria that has a predictable performance through a series of many setups. These trading systems can be ported over to many instruments such as Forex (FX), Cryptocurrency (Crypto), Options, Stocks, or anything that has a chart and a significant amount of volume and market participants.
If you are looking for trading systems to test out on your own here is a playlist of systems that I like: https://bit.ly/SystemsILike
WARNING: Be sure to do exhaustive backtesting and forward testing before you actually start trading real funds. For your convenience below is a link to the official Trader’s Landing backtesting spreadsheet and tutorial video.
🔍 Link to my Testing Performance Spreadsheet: https://traderslanding.net/results/
📘 Link to my free backtesting spreadsheet: https://traderslanding.net/2021/08/15/26/
📊 Link to all indicators tested on the channel: https://traderslanding.net/indicators/
🏠 System Web page: https://traderslanding.net/2021/07/30/20/
Timestamps:
00:00 - Start
00:33 - Indicators
02:00 - Long Examples
03:40 - Short Examples
05:15 - Test
05:42 - Testing Results & Equity Curve
06:46 - Optimization
System Specifics
Instrument: EUR/USD
Time Frame: 1 Hour Candles
Indicators
EMA
Settings: 200 Period
By: Built-In
Link: https://www.tradingview.com/support/solutions/43000592270-exponential-moving-average/
Time Segmented Volume (TSV)
Settings: Inputs at default
Style: Plot histogram to white, Plot line to Yellow
By: vitelot
Link: https://www.tradingview.com/script/6GR4ht9X-Time-Segmented-Volume/
Stochastic (STOCH)
Settings: Default
By: Built-In
Link: https://www.tradingview.com/support/solutions/43000502332-stochastic-stoch/
Stochastic RSI (STOCH RSI)
Settings: Default
By: Built-In
Link: https://www.tradingview.com/support/solutions/43000502333-stochastic-rsi-stoch-rsi/
SuperTrend X 3
Settings Super Trend 1:
Inputs: ATR Period: 12, ATR Multiplier: 3
Style: Remove highlighters, and removed Buy and Sell graphics.
Settings Super Trend 2:
Inputs: ATR Period: 11, ATR Multiplier: 2
Style: Remove highlighters, and removed Buy and Sell graphics.
Settings Super Trend 3:
Inputs: ATR Period: 10, ATR Multiplier: 1
Style: Remove highlighters, and removed Buy and Sell graphics.
By: KivancOzbilgic
Link: https://www.tradingview.com/v/r6dAP7yi/
Long Entry
Price is above the 200 EMA
At least 2 SupeTtrend lines below the price
Time Segmented Volume (TSV) is above the 0 line.
Use either the Stochastic or the Stochastic RSI for entry. The pullback brings one and/or other into the oversold territory. Enter on the cross of up of the indicator as long as both lines of the indicator are not touching the overbought zone.
Short Entry
Price under the 200 EMA
Two SuperTrend lines above price.
Time Segmented Volume (TSV) crosses below the 0 line.
Use either the Stochastic or Stochastic RSI for entry. The pullback brings one and/or other into overbought territory. Enter on the cross down of indicator as long as both lines of the indicator are not touching the oversold zone.
R:R
Half at 1:1, when 1:1 is hit move the rest of the position to breakeven.
Half at 2:1
Where to place stop-loss
For Long’s:
Previous swing low or furthest away SuperTrend, whichever is greater.
For Short:
Previous swing high or furthest away SuperTrend, whichever is greater.
Indicators tested on this channel so far:
ATR Bands, Donchian Channels (DC), Double Exponential Moving Average (DEMA), Dynamic Structure Indicator, Exponential Moving Average (EMA), Heikin-Ashi Candles, Ichimoku Cloud, Money Flow Index (MFI), Interstellar Buy/Sell, Interstellar Trend, Multi Timeframe EMA, QQE (Qualitative Quantitative Estimation) Mod, Relative Strength Index (RSI), SSL Channel, SSL Hybrid, Stochastic (STOCH), Stochastic RSI, SuperTrend STRATEGY, Time Segmented Volume (TSV), VuManChu Swing Free, Waddah Attar Explosion V2, Weighted Average Price (VWAP), Williams %R
Metatags
#TradingSystem #TheWorks #TradePro
Attribution
Link to Trade Pro’s Original Video:
https://www.youtube.com/watch?v=HpNZ2VpZzSE&t
Link to The Secret Mindset Time Segmented Volume (TSV) Video:
https://www.youtube.com/watch?v=WS3zSvL3H9U&t
-
 8:42
8:42
Trader's Landing
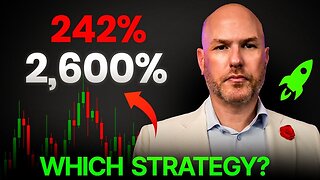
2 months ago $0.02 earnedFrom 242% to 2,600%: Which Strategy Would You Pick?
4201 -
 6:36
6:36
Trader's Landing
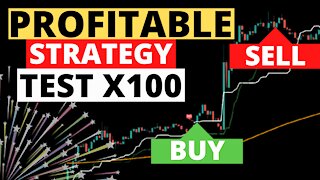
3 years ago $0.02 earnedSuperTrend + Ichimoku + EMA Strategy :-) Beginner Traders
249 -
 12:15
12:15
Realty, Games, Music Films
4 years agoStrategy
67 -
 2:21
2:21
Trading Robot - Global Trading Systems!
4 years ago $0.02 earnedFOREX ROBOT HIGH VOLUME INVESTOR - FOREX HIGH FREQUENCY SCALPING STRATEGY ON THE AUTOPILOT
69 -
 15:55
15:55
Bobman707
4 years ago $0.03 earnedColumn Capitol Volume
156 -
 2:27
2:27
Nutter's Speed Shop
3 years agoBlack Friday Polaris Ultra SP Triple Triple
78 -
 LIVE
LIVE
SilverFox
3 hours ago🔴LIVE - ARC AT NIGHT! COME THRU!
225 watching -
 2:46:09
Joker Effect
3 hours agoCLAVICULAR - What the hell is "Looks Maxing"? Asmond Gold is a Demon. KaceyTron. Steve Will do it.
26K2 -
 LIVE
LIVE
SlingerGames
2 hours agoLIVE - Wumble Wednesday - BIRTHDAY STREAM!
68 watching -
 LIVE
LIVE
StevieTLIVE
3 hours agoWarzone Win Streaking BIG Challenges MASSIVE Hype NO Losses LOCK IN
24 watching