How to Graph Linear Inequalities
Hello everyone! I hope you had a wonderful thanksgiving with your friends and family!
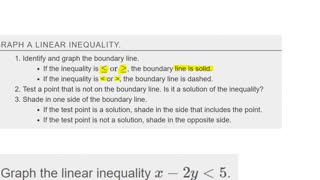
Today, I will talk about how to graph linear inequalities. A key thing you need to note is the inequality sign (greater than, greater than or equal to, less than, and less than or equal to) If the sign has a "or equal to", then the line you draw on the coordinate plane will be a solid line. If the sign is just a greater than or less than, the line you draw on the coordinate plane will be a dashed line. Regardless of the sign, you will need to shade one side on the line. You can find out which side to shade by picking a point on either side and plugging it into the inequality. Shade in the side where the point plugged into the inequality makes it true. Usually, the easier point to pick is (0,0) unless the line has a point (0,0) then just pick a different point.
Thanks for reading! I hope you enjoy my video! Let me know in the comments below if you have any questions.
Timestamps:
00:00 Intro to graphing linear inequalities
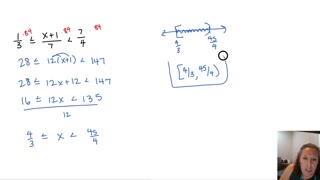
01:19 Practice Problem #1
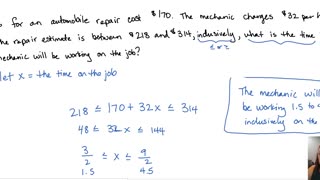
04:33 Practice Problem #2
07:06 Practice Problem #3
08:35 Practice Problem #4
For more math videos like this, be sure to subscribe to my channel https://rumble.com/user/CavemanChang
Hope you enjoyed my video! Thank you for watching!
Credits:
Custom Titles: Simple Video Making
Link: https://www.youtube.com/channel/UCOsPt0xImHyuRGU7BntSqDQ
-
 12:20
12:20
Math Videos
2 years agoLinear Inequalities
33 -
 9:04
9:04
Math Videos
2 years agoApplications of Linear Inequalities
66 -
 6:59
6:59
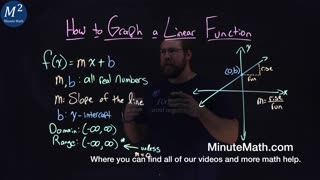
Minute Math
2 years agoHow to Graph a Linear Function | y=mx+b | Minute Math
21 -
 30:50
30:50
Algebra Lectures
3 years agoMath62_MAlbert_2.7_Solve linear inequalities
17 -
 13:28
13:28
Homeschool Math
3 years agoGraph inequalities - IXL A1.K.1 (H68)
4 -
 16:36
16:36
Algebra Lectures
3 years agoMath62_MAlbert_4.7_Graphs of linear inequalities
14 -
 26:19
26:19
Algebra Lectures
3 years agoMath62_MAlbert_5.6_Graphing systems of linear inequalities
15 -
 19:54
19:54
Algebra Lectures
3 years agoMath62_MAlbert_3.6_Solve applications with linear inequalities
36 -
 4:34
4:34
Minute Math
2 years agoHow to Graph Inequalities on a Number Line | Part 2 | 3 Examples | Minute Math
56 -
 4:37
4:37
Minute Math
2 years agoHow to Graph Inequalities on a Number Line | Part 1 | 3 Examples | Minute Math
45