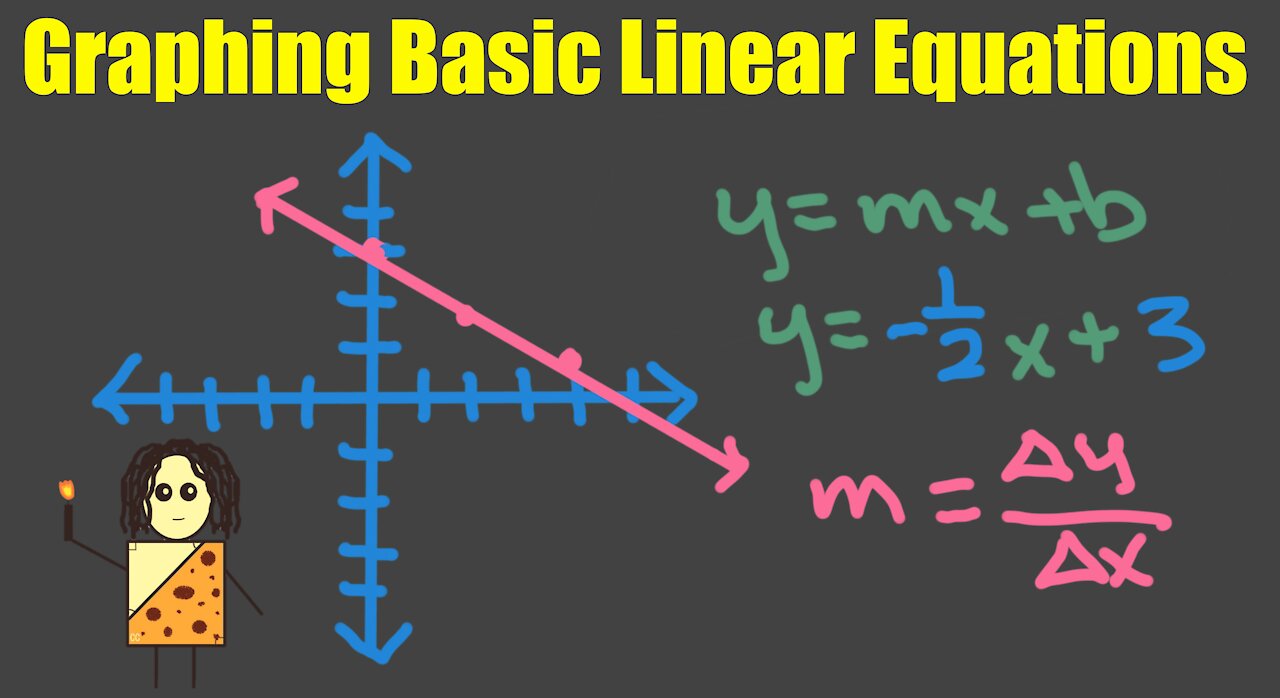
Graphing Basic Linear Equations
Hello! Today, I will be talking about how to graph basic linear equations. There are two methods that I will go over. The first one is using a "t-table" where we plug in x and solve for y. We make a table of the x and y then we plot them onto the coordinate plane and draw a line. This method is extremely tedious. The second method is the slope intercept method.
Slope Intercept Method: y=mx+b
In this equation, m is the slope and b is the y-intercept. By definition, slope is the change in y (how high from the point ) over the change in x (how wide from the point). The y-intercept is the point where it crosses the y-axis. The x-intercept is the point where it crosses the x-axis. Using the slope intercept method, it will be much easier to graph these basic linear equations. Let's jump right into it! I hope you enjoy this video, let me know in the comments if you have any questions.
Timestamps:
00:00 Intro to Graphing Basic Linear Equations
00:14 First Method to Graph Basic Linear Equations
00:34 T Table
02:03 Second Method to Graph Basic Linear Equations (Slope Intercept)
03:30 What is a slope?
04:18 What is an intercept?
05:56 2nd Example to practice the slope intercept method
07:30 3rd Example to practice the slope intercept method
09:04 Final Example to try on your own!
For more math videos like this, be sure to subscribe to my channel https://rumble.com/user/CavemanChang
Thanks for watching this video!
Credits:
Custom Titles: Simple Video Making
Link: https://www.youtube.com/channel/UCOsP...
-
 7:56
7:56
High School Math
4 years agoGraphing linear equations
76 -
 10:21
10:21
Leveling Up Math Skills with Basic | Caveman Chang
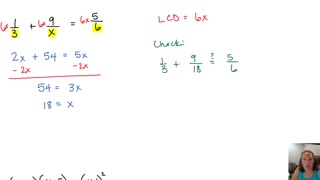
4 years agoSolving Basic Linear Equations (HOW TO) - Examples | CAVEMAN CHANG
37 -
 7:10
7:10
Math Videos
4 years agoSolving Linear Equations
76 -
 11:01
11:01
Math Videos
4 years agoLinear Equations in Disguise
39 -
 14:08
14:08
Math Videos
4 years agoRational Equations that Become Linear
23 -
 8:47
8:47
Leveling Up Math Skills with Basic | Caveman Chang
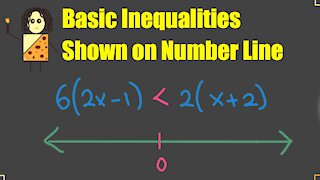
4 years agoGraphing Basic Inequalities on a Number Line
32 -
 7:47
7:47
Minute Math
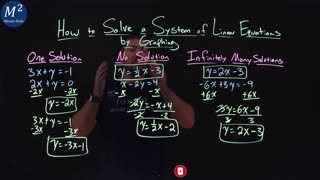
4 years agoSolve Systems of Linear Equations by Graphing | One Solution, No Solution, Infinitely Many Solutions
42 -
 20:37
20:37
Homeschool Math
4 years agoSolve advanced linear equations - IXL A1.J.5 (28N)
20 -
 18:33
18:33
Homeschool Math
4 years agoSolve one-step linear equations - IXL A1.J.3 (TXJ)
21 -
 15:12
15:12
Homeschool Math
4 years agoSolve two-step linear equations - IXL A1.J.4 (QAK)
34