Stock Market Valuation Series Part 3: The Yield Curve Model
My Exclusive Free Workshop The Four P's of Building a Successful Investing Program → https://spxinvesting.mailchimpsites.com
Blog: https://spxinvestingblog.com
https://www.facebook.com/groups/43384...
https://www.multpl.com/sitemap
https://www.currentmarketvaluation.com/
Videos Referenced:
Valuation Video Part 1 Miltpl.com: https://youtu.be/y0BxSkpJotA
Valuation Video Part 2 The Shiller PE Ratio: https://youtu.be/3VNCA89kWDo
Is the Stock Market Getting Ready to Crash? https://youtu.be/F4VUuOBy4mc
S&P 500 P/E Ratio Valuation Update August 1, 2021: https://youtu.be/9f3JSj0EpUY
Stock Market Valuation
Part 3
The Yield Curve Model
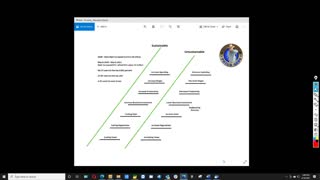
Tools can be used to determine if the stock market is:
Overvalued: Expensive
Undervalued: Cheap
Fairly Valued: Just about right
Current Market Valuation
Yield Curve Model
(10-year Treasury Yield) - (3-month Treasury yield) = Yield Spread
Positive: Bullish
Usually means economic growth.
Negative: Bearish
Usually followed by a recession.
Recession:
GDP declines for two successive quarters.
An inverted yield curve usually precedes a recession by 6-18 months.
Recessions usually produce stock market declines.
GDP
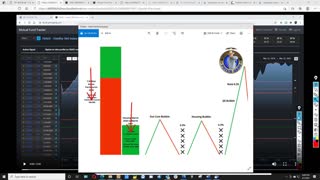
Normal Yield Curve
Current Yield Curve
Inverted Yield Curve
Positive Yield Curve
Negative Yield Curve
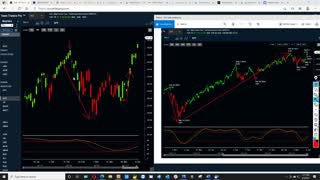
Historical spread
Daily observation
Conclusion
The Yield Curve Model posted by the Current Market Valuation website is at FAIR VALUE.
Other Stock Market Valuation measurements show that the S&P 500 is OVERVALUED.
No immediate action is necessarily warranted.
However, it is necessary to have a plan developed and in place in case the market environment changes.
If other measurement tools suggest a major change in trend (up to down) implementing a plan will be in order for:
Those who have only long positions (defensive).
Those who participate in short positions (offensive).
-
 39:19
39:19
The SPX Investing Program
6 days ago $0.02 earnedS&P 500 Daily Market Update for Tuesday April 30, 2024
51 -
 21:37
21:37
The SPX Investing Program
2 years ago $0.09 earnedMarket Valuation Series Part 1: Multpl.com
194 -
 18:27
18:27
The SPX Investing Program
2 years ago $0.20 earnedMarket Valuation Series Part 2: Shiller PE Ratio
245 -
 4:19
4:19
Fanatical Finance
2 years agoUnderstanding the Stock Market Part 2! | What is the Stock Market?
645 -
 8:17
8:17
The Phil's Gang Radio Show Channel
2 years agoStock market crash starting to unfold part 22
63 -
 8:51
8:51
The Phil's Gang Radio Show Channel
2 years agoStock market crash starting to unfold part 16
29 -
 8:24
8:24
The Phil's Gang Radio Show Channel
2 years agoStock market crash starting to unfold part 15
17 -
 7:29
7:29
The Phil's Gang Radio Show Channel
2 years agoStock market crash starting to unfold part 14
40 -
 7:06
7:06
The Phil's Gang Radio Show Channel
2 years agoStock market crash starting to unfold part 13
18 -
 2:27:12
WeAreChange
5 hours agoMiddle East Peace Process Breaks Down in the 23rd Hour: Brace for Impact
43.4K28