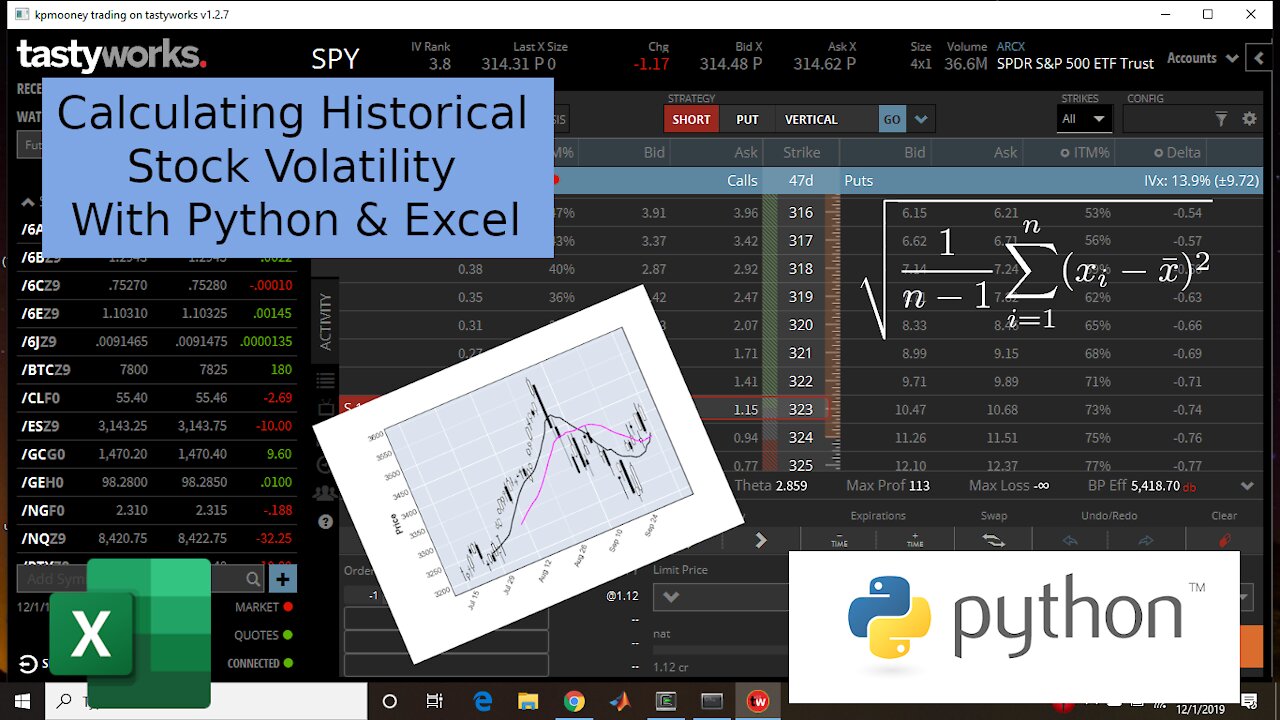
Calculating Historical Stock Volatility with Python and Excel
4 years ago
19
A viewer asked if I could do a video on how to calculate historical volatility of a stock in Excel. In this video, I will explain how to do so using Python’s pandas package as well as Numpy. I will, of course, show the same thing in Excel.
Github Jupyter Notebook: https://github.com/kpmooney/numerical_methods_youtube/blob/master/market_analysis/Historical%20Volatility.ipynb
Github Excel Sheet: https://github.com/kpmooney/numerical_methods_youtube/blob/master/market_analysis/historical%20Volatility.xlsx
Tip Jar: https://paypal.me/kpmooney
Loading comments...
-
 21:34
21:34
kpmooney
4 years agoLognormal Distributions: Calculating the Probability of a Stock Range with Excel and Python
42 -
 15:12
15:12
kpmooney
4 years agoCalculating Simple Statistics with Python and Pandas: Stock Market Data
51 -
 13:26
13:26
kpmooney
4 years agoCalculating the Implied Volatility of an Option with Excel (or Google Sheets)
113 -
 11:24
11:24
kpmooney
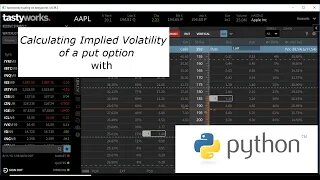
4 years agoCalculating the Implied Volatility of a Put Option Using Python
9 -
 21:36
21:36
kpmooney
4 years agoCalculating Implied Volatility from an Option Price Using Python
134 -
 13:24
13:24
Educational Videos
4 years agoHacking with Python 3/17
44 -
 3:19
3:19
Educational Videos
4 years agoHacking with Python 1/17
66 -
 11:14
11:14
Evil Programmer
4 years agoPython: How to export data to Excel with xlsxwriter
54 -
 7:21
7:21
Educational Videos
4 years agoHacking with Python 10/17
61 -
 LIVE
LIVE
The Big Mig™
3 hours agoInsider Trader Of The Year Award Goes To Nancy Pelosi
2,352 watching