Stock Forecasting Indicator Trend Probability Map
2 years ago
721
Stock Forecasting Indicator Trend Probability Map
https://tradingrobot.trade/altredo-stock-forecasting-indicator-tradestation.aspx
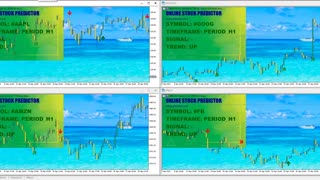
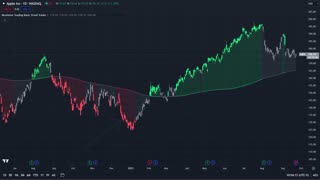
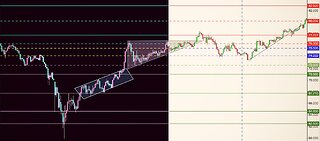
STOCK FORECASTING INDICATOR TREND PROBABILITY MAP
▶️ The Stock Predictions & Stock Forecasting Probability Map indicator is designed to predict future price movements and trends in stocks, futures and currencies. Powered by TradeStation platform. The indicator forecasting algorithm is based on linear regression. The indicator is remarkable in that, in addition to predicting the trend of stocks, it also visually shows the boundaries of the forecast error in the form of a Probability Map. The indicator is designed for use on 1 Day timeframes, it can also be used on weekly and monthly timeframes: 1 Week, 1 Month.
Loading comments...
-
 1:19
1:19
Trading Robot - Global Trading Systems!
2 years agoONLINE STOCK PREDICTOR
738 -
 2:04
2:04
Trading Robot - Global Trading Systems!
2 years agoFOREX SIGNALS AND TREND FORECASTING INDICATOR
898 -
 15:11
15:11
Revelator Trading
2 months agoMoving Averages and Trend Trading
15 -
 2:59
2:59
PersistentTradingGroup
1 year agoHow To Draw Trend Lines On A Chart Explained Simply (forex, stocks, crypto)
10 -
 1:49
1:49
Revelator Trading
2 months agoBasic Trend Trader 100% FREE
13 -
 2:36
2:36
Ascencore
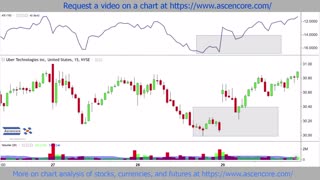
5 months agoAccumulation Swing Index (ASI) Indicator Example UBER Stock Chart
9 -
 10:28
10:28
Ascencore
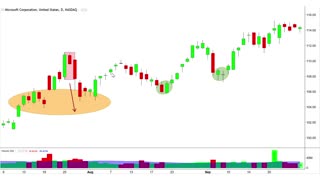
6 months agoHarami (Candlestick Charting Pattern) Example Case Study With MSFT Stock Chart
12 -
stewdamus
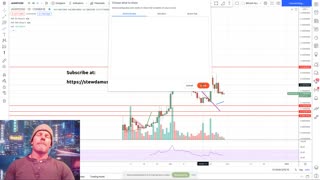
2 years agoJasmy Coin - Chart along with me. Let's find potential targets.
20 -
 7:22
7:22
Milgard
6 months agoHow To Find Trendlines On Cryptocurrency Charts BTC-USD Case Study
13 -
 11:52
11:52
Ascencore
6 months agoHow To Use Candlestick Patterns (Doji Example Case Study (WM Stock Chart))
21