Premium Only Content

Two Types of Technical Analysis Indicators
My Exclusive Free Workshop The Four P's of Building a Successful Investing Program → https://spxinvesting.mailchimpsites.com
https://spxinvestingblog.com
https://www.facebook.com/groups/433843641082343
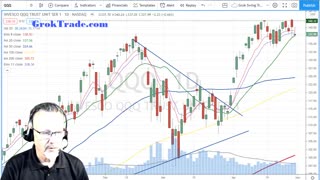
Technical Analysis is a visually based systematic method for determining the future movement of an index, stock, mutual fund, bond, or any tradeable security. Technical Analysis can help you to determine when to enter or exit, or also to find stocks that meet specified criteria.
Many use only technical analysis when making a decision. I have found that when you combine Fundamental Analysis, Mental Analysis, and Technical Analysis, a powerful strategy can be developed and implemented. This approach is called the Consensus Approach and is taught by the SPX Investing Program.
There are two types of Technical Analysis indicators:
- Moving averages (SMA, EMA, Smoothed Moving Averages, Weighted Moving Averages);
- Oscillators.
Links that I mention:
https://stockcharts.com
https://metastock.com
https://TDAmeritrade.com
https://tastyworks.com
Books mentioned in this video:
Bollinger on Bollinger Bands by John Bollinger;
Technical Analysis of the Financial Markets by John Murphy
My Exclusive Free Workshop The Four P's of Building a Successful Investing Program → https://spxinvesting.mailchimpsites.com
-
 59:56
59:56
The SPX Investing Program
4 days agoS&P 500 Daily Update for Tuesday November 18, 2025
28 -
 0:41
0:41
ChartAction
4 years ago#Dogecoin #investing #education Possible Support Levels Technical Analysis
49 -
 15:22
15:22
Grok Trade
4 years agoStock Market News and Technical Analysis
46 -
 4:07
4:07
ChartAction
4 years agoNIO Technical Analysis - Bearish Divergence
43 -
 31:23
31:23
Stephen Gardner
2 hours agoFINALLY! Charlie Kirk MISSING DETAILS released!
17.7K104 -
 5:26:11
cosmicvandenim
7 hours agoCOSMIC VAN DENIM | SEX APPEAL & HORROR
12.5K10 -
 LIVE
LIVE
DoldrumDan
3 hours agoFINISHING SEKIRO - DEPTH 5 TOP RANKED - DAY 50 NEW LIFE
27 watching -
 23:40
23:40
MYLUNCHBREAK CHANNEL PAGE
1 day agoWe Want the Blueprints
54K16 -
 LIVE
LIVE
PenguinSteve
4 hours agoLIVE! Penguin to the Battlefield (6)
58 watching -
 1:08:20
The Quartering
5 hours agoMTG Quits, Indian X Meltdown & FBI Caught Lying Again About Trump Assassin
136K71