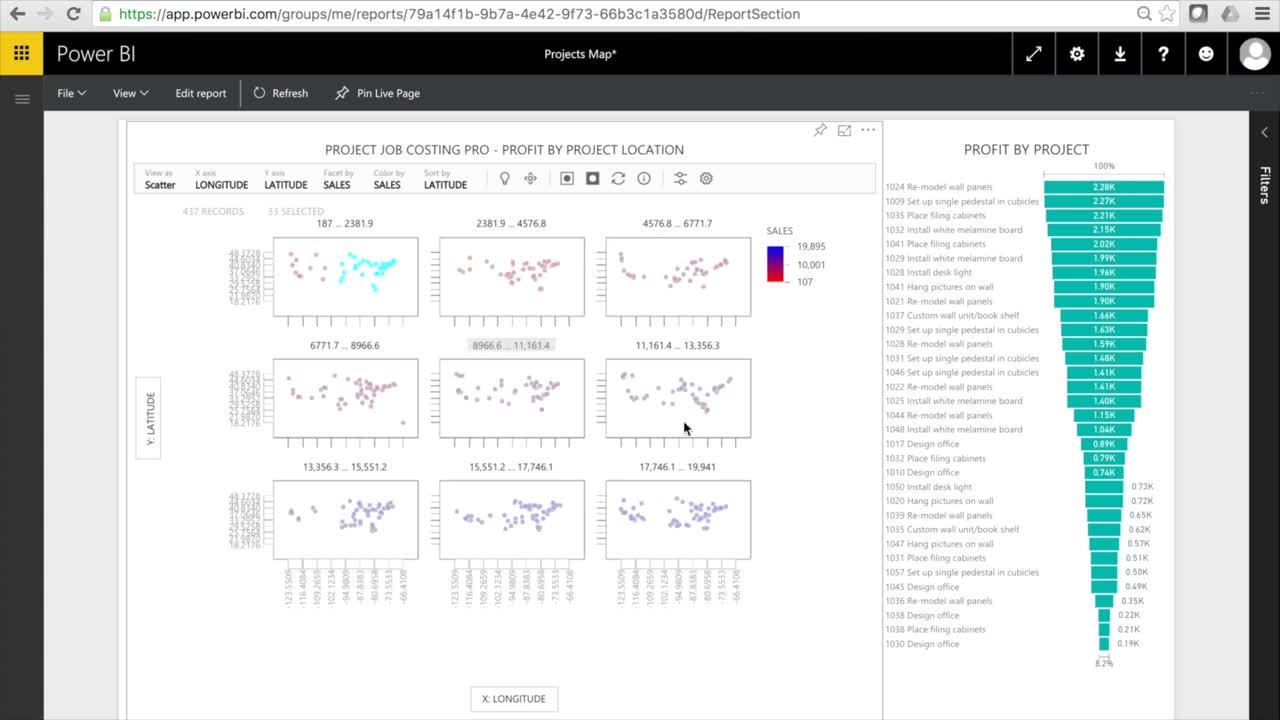
Project & Job Profitabiliity with the PowerBI SandDance Chart
4 years ago
21
The PowerBI Team has been innovating and releasing those innovations at an astounding rate. They use the jazzy LineDot Chart (which is one of those innovations) to show the rate at which PowerBI is benefiting from user-driven innovations.
www.getfreshbi.com
Loading comments...
-
 27:46
27:46
INTEGENT LLC
4 years ago $0.01 earnedProject Ideation with Microsoft Project Online
52 -
 39:16
39:16
SuperCoolRadio
4 years agoPlaying Vegan With Red Queen Project
19 -
 0:24
0:24
WFTX
4 years agoWhitehouse moves forward with wind project
971 -
 6:38
6:38
2guys1boat
4 years agoGetting Started with our new boat project
11 -
 2:37
2:37
NightWaterProject
4 years agoKeep updated with Night Water Project
24 -
 LIVE
LIVE
Tucker Carlson
3 hours agoBraxton McCoy: Iraq, Opioids, and Defending US Land From Foreign Governments & Corporate Giants
3,932 watching -
 LIVE
LIVE
Dr Disrespect
2 hours ago🔴LIVE - DR DISRESPECT - STREAMING UNTIL WE GET 10 WINS
2,548 watching -
 LIVE
LIVE
Donut Operator
3 hours agoCRIME/ CYCLISTS ARE SCUM/ GAMEBOY CAMERA CHAD
559 watching -
 LIVE
LIVE
Barry Cunningham
3 hours agoPRESIDENT TRUMP GOES SCORCHED EARTH ON "FAKE SUPPORTERS" | AND OTHER NEWS!
1,808 watching -
 15:18
15:18
Preston Stewart
4 hours agoViolence Spreads in Syria
29