
What is Hyperinflation?
A short video on what is and how to identify HYPERINFLATION.
Script:
What is hyperinflation?
It is when the price of goods and services rise more than 50% in a given month.
Hyperinflation means the price of something in the morning would cost more in the afternoon.
Hyperinflation starts when the country's government begins printing or borrowing money to pay for its spending. As the cycle of printing or borrowing money continues goods and services cost more.
To keep from paying more in the future citizens begin hoarding which in turn creates shortages. As people hold perishable goods such as bread will produce these daily supplies become scarce the downward spiral continues causing hyperinflation.
Hyperinflation example: Following World War I, between 1918 and 1924, the German government kept printing money. Doing so the price of money increased, causing the exchange rate to rise from 4 Deutsche Marks, to more than one trillion Deutsche Marks for 1 US dollar.
One trillion means the number one followed by twelve zeroes. One trillion seconds equal 31,546 years. Many generations will have come and gone over the 1 trillion seconds.
Consider a football field from goal post to go post, filled with $100 bills stacked to a little over seven feet high; that is just under 1 trillion dollars.
Returning to the German exchange rate, think of that football field being filled with 100 D-Marks bills and not one hundred dollar bills. Iin nineteen twenty four the football field of the marks was equal to one dollar. Could a person carrying a football field of bills to buy a loaf of bread at the bakery?
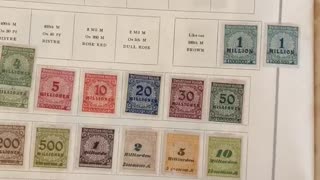
The German government started printing higher denomination bills: 1 thousand Marks, 1 million Marks, 1 milliard Marks, a milliard is known as 1 billion in the US, 1 billion Marks, a billion is known as 1 trillion in the US.
This one billion Mark bill replace the football field of one US trillion dollars. Even then, wheel barrows and baskets were used to carry money to the market. The lower denomination bills became worthless. Being used as wallpaper, as fuel for fire, clothing, children played with money, even making and flying kites made of the worthless money.
During this period, production collapsed leading to a shortage of goods, especially food.
Because there was excess cash in circulation and few goods, the price of everyday items doubled every 3.7 days. The inflation rate was 20.9% per day.
Remember, the definition of hyperinflation is the inflation rate goes over 50% in a given month.
Farmers and others who produced goods did well. However, most people lived in severe poverty.
Take note, when it comes to start printing or borrowing massive amounts of money that could be an early sign of hyperinflation.
Let's take a moment and examined the US national debt. In 1837, at the end of Andrew Jackson's administration, the national debt was $336,000. Remember the football field? A stack of $100 bills for $336,000 would be about 1½ inches high.
Over the next 144 years, the national debt continued to slowly accumulate. By 1981, at the beginning of Ronald Reagan's administration, the national debt was just under $1 trillion. Since then, the debt continued to rapidly increase. A yellow line was added at each $5 trillion level to help to separate the mounting debt.
On January 20th, the day president Biden took office, the US national debt was just over $27 trillion. Within weeks of his inauguration, the national debt grew to over $28 trillion. In early March the US House of Representatives and the US Senate, passed HR 1319, the $1.9 trillion American Rescue Act, also known as, the Coronavirus Simulates Bill. Which will bring the debt to about $30 trillion. On the near horizon is the climate and infrastructure bill which would add another $2 trillion to the US national debt, making it about $32 trillion. One may I ask where will the money come from.
At the beginning of this lesson, we learned hyperinflation is caused by printing and borrowing money.
An interesting Internet site is the US debt clock at USDebtClock.org. In the upper left is the US national debt. Skip over the box to the right, to the debt per taxpayer box. That $223,893, is the debt each US taxpayer is responsible for. You may notice most of the information is rapidly changing. This real time clock contains a plethora of information well worth investigating.
Money Stacks Avalanche: Wealth Visualization Manifestation HD video courtesy of Conqueror Designs. https://conquerordesigns.com
-
 0:14
0:14
tictoc
4 years ago $0.03 earnedHyperInflation explained
166 -
 7:44
7:44
Cahlen
3 years agoPrepare for Hyperinflation
133 -
 4:56
4:56
BrookeKing
3 years ago $0.02 earnedHyperinflation In Real Life
120 -
 4:58
4:58
Corey Chambers
3 years ago $0.07 earnedHyperinflation and Home Prices
337 -
 6:16
6:16
thehighestdegree
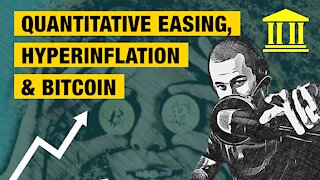
4 years agoQuantitative Easing, Hyperinflation & Bitcoin - Overview
71 -
 12:55
12:55
yellowgenius
4 years agoArgentina & Venezuela Inflation/Hyperinflation Info And Examples.
1971 -
 2:11:38
AP4Liberty
3 hours ago $2.14 earnedLuigi Mangione: Elite Anticapitalist Killer? Or COVID victim?
7.98K4 -
 LIVE
LIVE
Matt Kohrs
12 hours agoCPI Inflation Report, Tesla Pushes Higher & Live Trading || The MK Show
1,361 watching -
 37:33
37:33
BonginoReport
4 hours agoWhy Is the FBI Lying About the NJ Drone Invasion? (Ep.102) - 12/11/2024
62.6K151 -
 41:01
41:01
The Why Files
4 hours agoOperation Eagle Flight: The Escape from Berlin to Bariloche
48K35