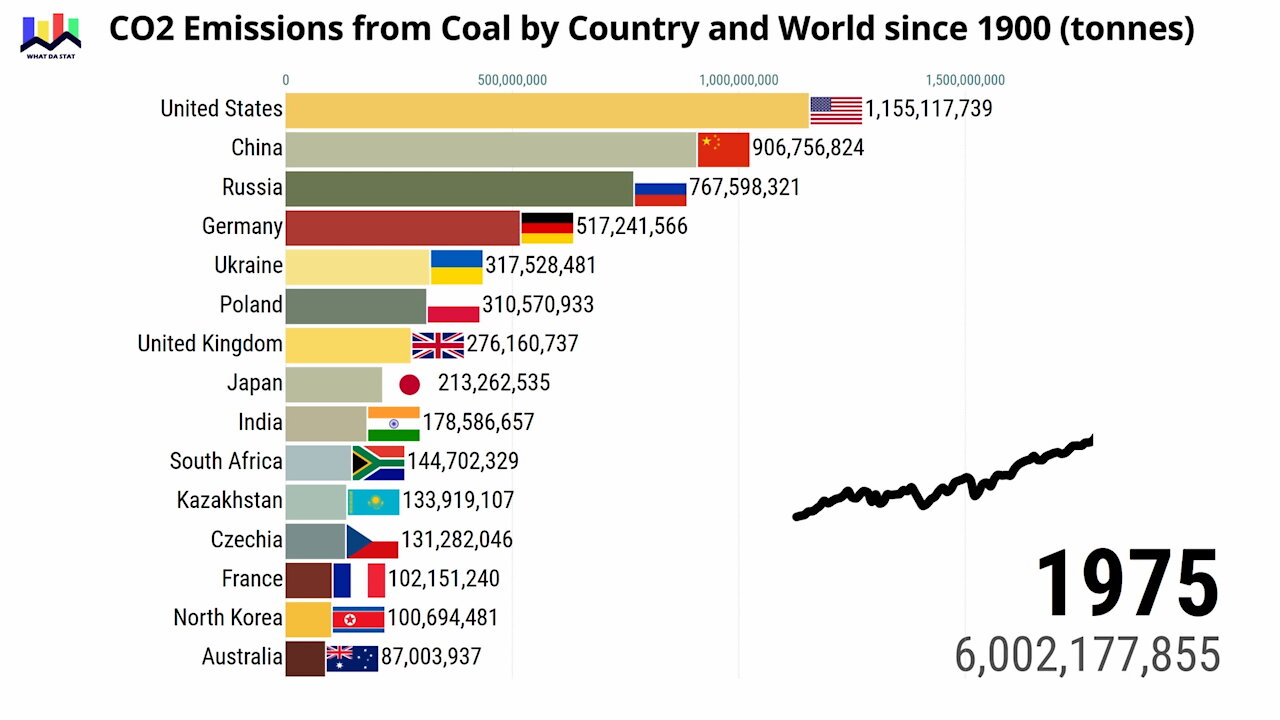
Annual CO2 Emissions from Coal by Country and World since 1900
4 years ago
12
This bar chart race shows the annual CO2 emissions from coal, by country and world since 1900 measured in tonnes.
The countries and their flags are shown as they exist today.
Data for the Soviet republics/later countries are shown from 1960.
Source: Global Carbon Project (GCP) and Carbon Dioxide Information Analysis Center (CDIAC)
Music:
Original music by Savfk
https://www.youtube.com/savfkmusic
https://www.facebook.com/savfkmusic
Savfk - Reloaded is under a Creative Commons Attribution 4.0 International License (CC BY 4.0)
https://creativecommons.org/licenses/by/4.0/
Loading 1 comment...
-
 5:23
5:23
WhatDaStat
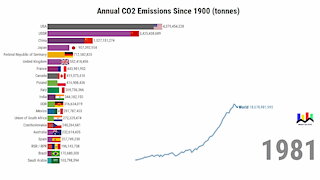
4 years agoAnnual CO2 Emissions Since 1900
471 -
 4:42
4:42
WhatDaStat
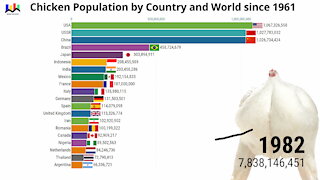
4 years agoChicken Population by Country and World since 1961
108 -
 1:06:13
The Rubin Report
2 hours agoDave Tries Controversial New Medical Tech — Was It a Miracle or a Bust?
15.4K19 -
 LIVE
LIVE
The Shannon Joy Show
3 hours ago🔥🔥Trump Deploys Nuclear Submarines, JD Vance Promises To Investigate The Aliens & The Epstein Re-Brand Begins🔥🔥
235 watching -
 LIVE
LIVE
LFA TV
14 hours agoLFA TV ALL DAY STREAM - MONDAY 8/4/25
4,170 watching -
 1:00:15
VINCE
4 hours agoThe Obama Connection No One Is Talking About | Episode 95 - 08/04/25
181K247 -
 1:31:29
Caleb Hammer
19 hours agoThe Most Hated Woman In Financial Audit History
18.9K1 -
 1:09:39
The Big Mig™
5 hours agoCharlamagne Tha Crap, “A Racist Sleazbag”
12.4K11 -
 1:45:17
Dear America
4 hours agoDear GOP, Do Your Job or GET OUT!! + Trump Calls Out Chuck Schumer For DEMANDING $1 BILLION!!
144K114 -
 1:54:28
Badlands Media
7 hours agoBadlands Daily: August 4, 2025
62.8K5