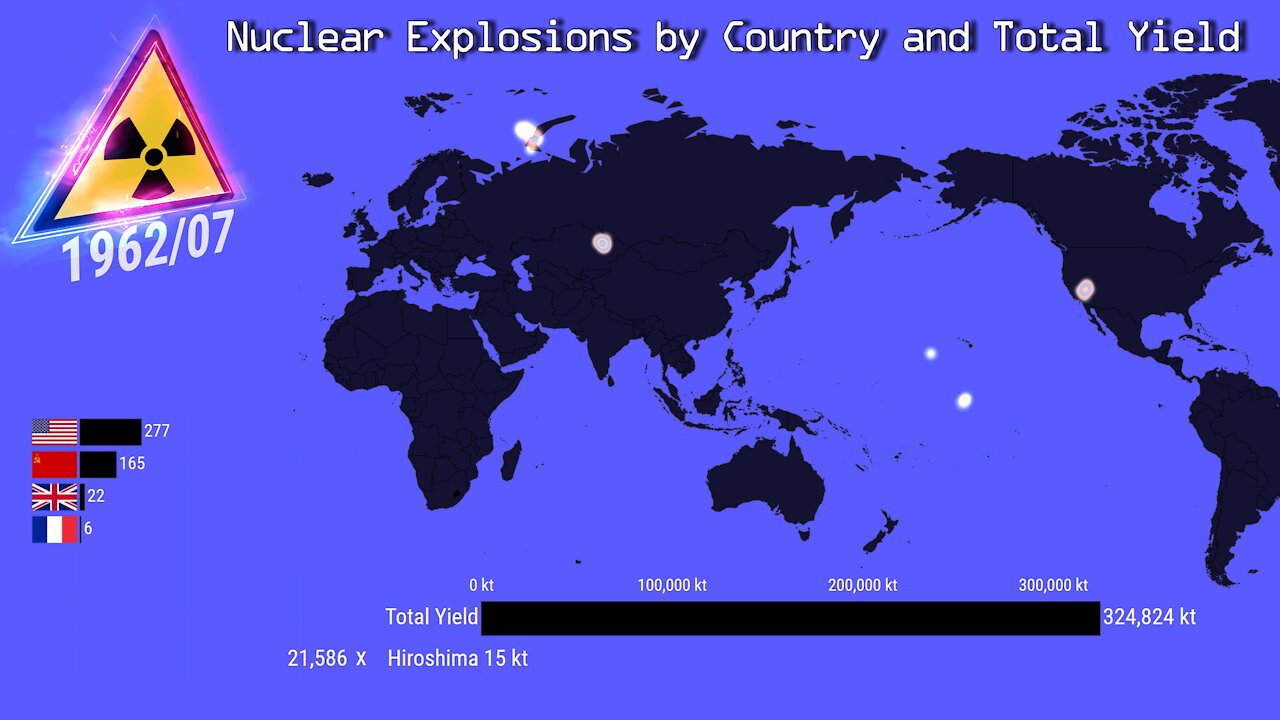
☢ Nuclear Explosions by Country and Yield since 1945 ☢
4 years ago
40
How much have we nuked the planet?
This bar chart shows the number of nuclear explosions by country, locations the map, and total yields since 1945. Two was detonated in war and rest as test.
From 1999 to 2006 there we no known tests. So this period is skipped on the timeline.
Max estimated yields is used.
Music:
White Bat Audio - Androids & Sentient Beings
Karl Casey @ White Bat Audio https://whitebataudio.com
Special Effect by:
AA VFX: https://www.youtube.com/c/dvdangor2011/
Loading comments...
-
 3:05
3:05
WhatDaStat
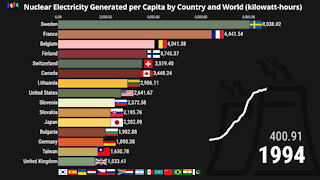
4 years agoNuclear Electricity Generated per Capita by Country and World since 1965
95 -
 3:16
3:16
WhatDaStat
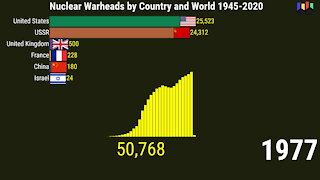
4 years ago $0.01 earnedNuclear Warheads by Country and World 1945-2020
112 -
 4:42
4:42
WhatDaStat
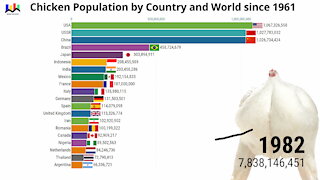
4 years agoChicken Population by Country and World since 1961
108 -
 10:05
10:05
MattMorseTV
9 hours ago $5.71 earnedHe actually did it...
55.1K18 -
 1:32:39
Anthony Rogers
1 day agoEpisode 376 - Todd Schowalter
19.7K -
 3:42:07
megimu32
5 hours agoOTS: Movie Tie-In Games + Remakes: Let’s Play Memory Lane
29.9K5 -
 1:15:06
Adam Does Movies
12 hours ago $0.79 earnedTalking Movies + Ask Me Anything - LIVE
22K1 -
 1:17:18
Glenn Greenwald
1 day agoWhat are CBS News' Billionaire Heirs Doing with Bari Weiss? With Ryan Grim on the Funding Behind It; Europe Capitulates to Trump Again | SYSTEM UPDATE #494
108K83 -
 1:43:49
RiftTV
7 hours agoCNN Calls Black NY Shooter WHITE, Cincinnati FATIGUE | The Rift | Guest: Braeden Sorbo, 2Protects1
49.6K15 -
 4:21:04
LumpyPotatoX2
8 hours agoKilling Floor 3: Rampage & Chaos - #RumbleGaming
17.2K1