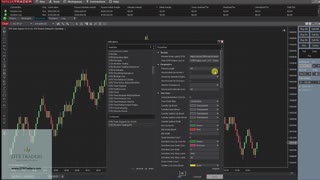
TradeStation EasyLanguage Quick-tip 50 | Find the lowest RSI and how many bars ago it occurred
Quick-tip 50 is an TradeStation EasyLanguage indicator, designed to look back a number of bars specified by user input: RSIMaxBarsBack, to find what the lowest value of RSI was (RSIMinValue) and how many bars ago it occurred (RSIMinBarsBack). The indicator plots the RSI value, RSIMinValue, and RSIMinBarsBack. It works on charts and RadarScreen.
Because the calculation of RSI is an accumulative calculation it is important to load sufficient data. On the chart this is done by setting how much history to load. In RadarScreen it is achieved by using the “Load additional data for accumulative calculations” setting. For the RSI calculation, TradeStation recommends a smoothing factor of 9.5 multiplied by the RSI length, in this case the user input RSILength.
Make sure that the chart is set to local time and the indicator is set to update value intra-bar.
Gold Pass members may download the program below. This Quick-tip is for TradeStation and MultiCharts users.
-
 4:15
4:15
1000mileman
2 years ago $0.05 earnedTradeStation - Tip 101 Platform Preferences
2015 -
 7:45
7:45
TradeStation 10 Tips
2 years agoTradeStation Tip 106 - Data Delay in Stocks
57 -
 3:30
3:30
Petes Investing
2 years agoRelative Strength Index 2 strategy quickie
2 -
 9:49
9:49
Petes Investing
3 months agoAUDNZD NZDCAD USDCAD USDJPY Technical Analysis Apr 12 2024
18 -
 12:50
12:50
DTBTradersNinjaTrader8
2 years agoNinjaTrader 8 Tools - 02.6 - DTB Indicators 6
23 -
 7:20
7:20
Kozbo
1 year agoTradingView Indicators With ChatGpt
1 -
 3:37
3:37
Petes Investing
1 year agoUSDJPY Technical Analysis Jul 16 2023
-
 6:10
6:10
EACoders
8 months agoFibonacci SR Indicator For MT4 - Free Metatrader Support & Resistance Indicator
4 -
 3:34
3:34
Petes Investing
1 year agoUSDJPY Technical Analysis Jun 08 2023
3 -
 5:27
5:27
Petes Investing
1 year agoUSDJPY Technical Analysis Jun 28 2023
2