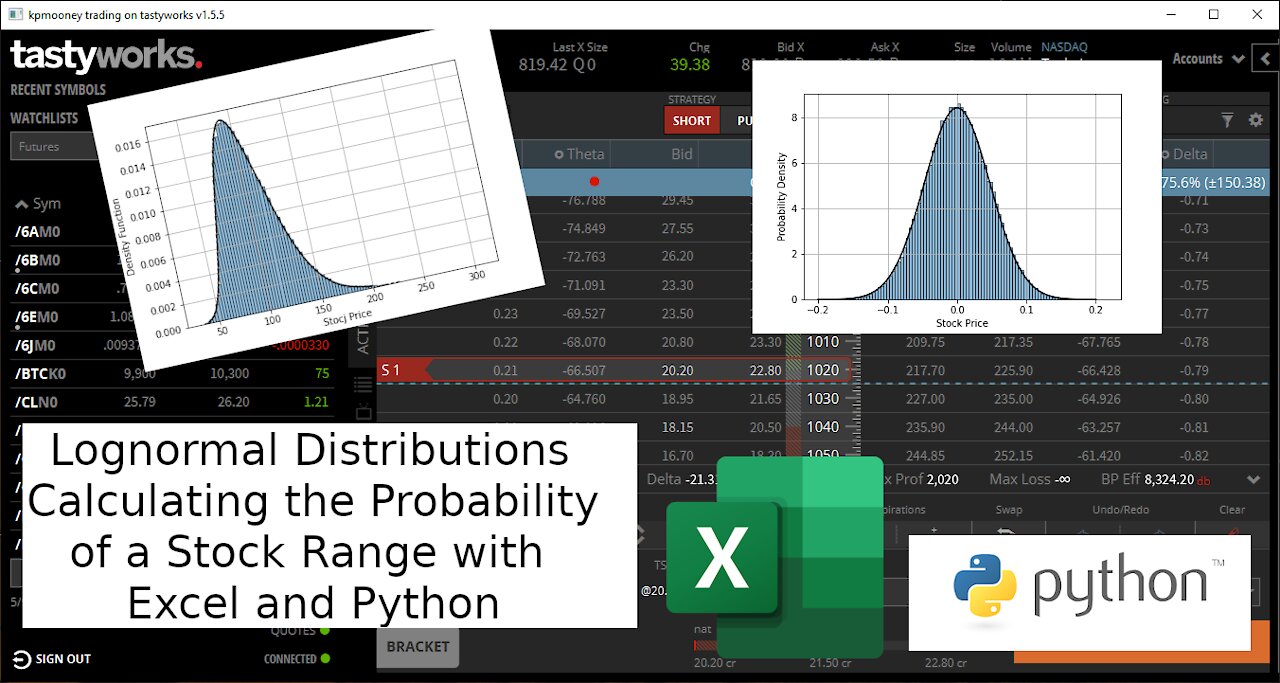
Lognormal Distributions: Calculating the Probability of a Stock Range with Excel and Python
4 years ago
42
In response to a viewer question, we look at how to calculate the probability a stock will be in a given price range at a certain time given its implied volatility. We will compare this against our Monte Carlo simulations worked out last year. We will do the calculation both in Excel and Python.
Tip Jar: https://paypal.me/kpmooney
Github: https://github.com/kpmooney/numerical_methods_youtube/tree/master/lognormal
Stock Monte Carlo and Linear Systems: https://youtu.be/AC_4gjSYzu0
Loading comments...
-
 15:12
15:12
kpmooney
4 years agoCalculating Simple Statistics with Python and Pandas: Stock Market Data
52 -
 12:34
12:34
kpmooney
4 years ago $0.01 earnedCalculating Probability of Making 50% of Max Profit on a Short Strangle Using Python
45 -
 13:53
13:53
kpmooney
4 years agoCalculating the Correlations Between Stocks Using Python
59 -
 18:24
18:24
kpmooney
4 years agoProbability of a Touch in Finance using Python Monte Carlo Methods
41 -
 14:06
14:06
pcomitz
4 years agoGetting Started with Python
194 -
 13:26
13:26
kpmooney
4 years agoCalculating the Implied Volatility of an Option with Excel (or Google Sheets)
114 -
 5:38
5:38
Subjectmoney.com
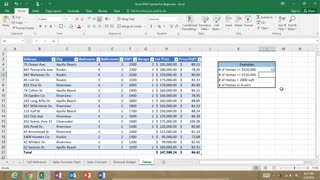
4 years ago $0.01 earnedExcel COUNTIF Function Tutorial: Excel 2016 Range Criteria Greater Than
76 -
 21:36
21:36
kpmooney
4 years agoCalculating Implied Volatility from an Option Price Using Python
134 -
 11:24
11:24
kpmooney
4 years agoCalculating the Implied Volatility of a Put Option Using Python
10 -
 16:19
16:19
kpmooney
4 years agoNumerically Integrating Differential Equations in Excel and Python: Euler's Method
29