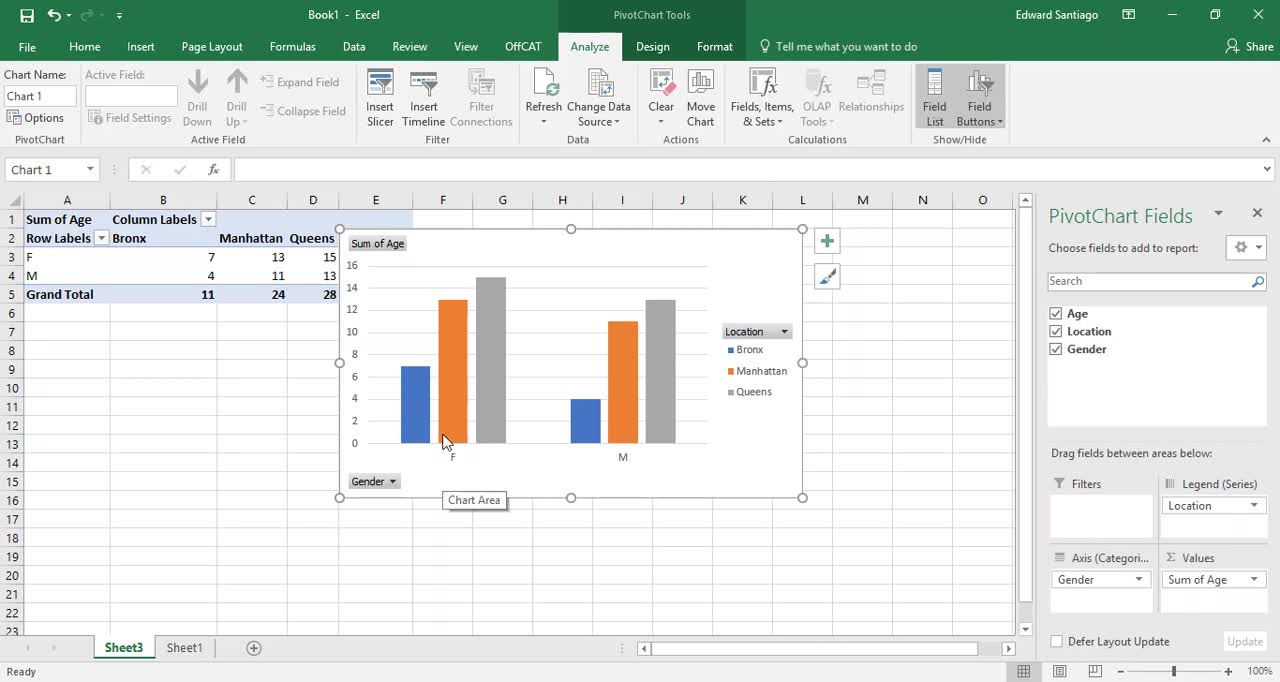
Microsoft Excel Tutorial - Pivot Charts
Loading comments...
-
 0:45
0:45
Performing in an Academic Environment
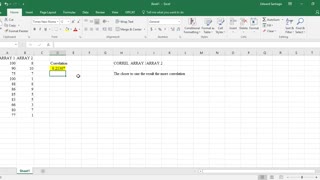
4 years agoMicrosoft Excel Tutorial - Correlation
111 -
 1:01
1:01
Performing in an Academic Environment
4 years agoMicrosoft Excel Tutorial - If Statement
50 -
 36:15
36:15
Subjectmoney.com
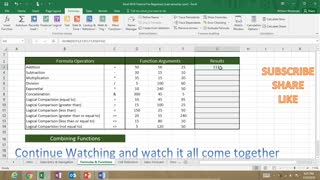
4 years agoMicrosoft Excel 2016 Tutorial For Beginners Part 2 Full Intro
169 -
 8:13
8:13
Subjectmoney.com
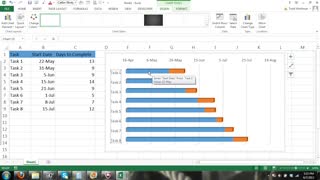
4 years agoMicrosoft Excel Gantt Chart Tutorial - How to Create a Gantt Chart w/Excel 2013 Bar Chart
97 -
 12:10
12:10
Kaceli TechTraining
4 years agoExcel 2019 Microsoft 365 Basic Formulas and Functions - A Basic Tutorial on Excel
98 -
 1:06:03
Subjectmoney.com
4 years ago $0.02 earnedMicrosoft Excel Tutorial for Beginners Part 1 Full Intro Learn How to Use Excel
82 -
 4:15
4:15
Subjectmoney.com
4 years agoHow to Enter Large Numbers/Credit Card Numbers Into Microsoft Excel Tutorial
24 -
 2:28
2:28
Performing in an Academic Environment
4 years ago $0.02 earnedMicrosoft Word Tutorial - Academic Paragraphs
128 -
 28:03
28:03
Microsoft Excel
4 years agoExcel Week 3: Movie Budget and Acct. Tutorial
88 -
 5:38
5:38
Subjectmoney.com
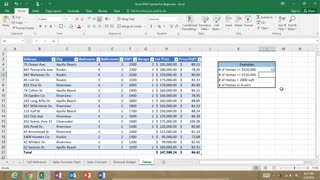
4 years ago $0.01 earnedExcel COUNTIF Function Tutorial: Excel 2016 Range Criteria Greater Than
75