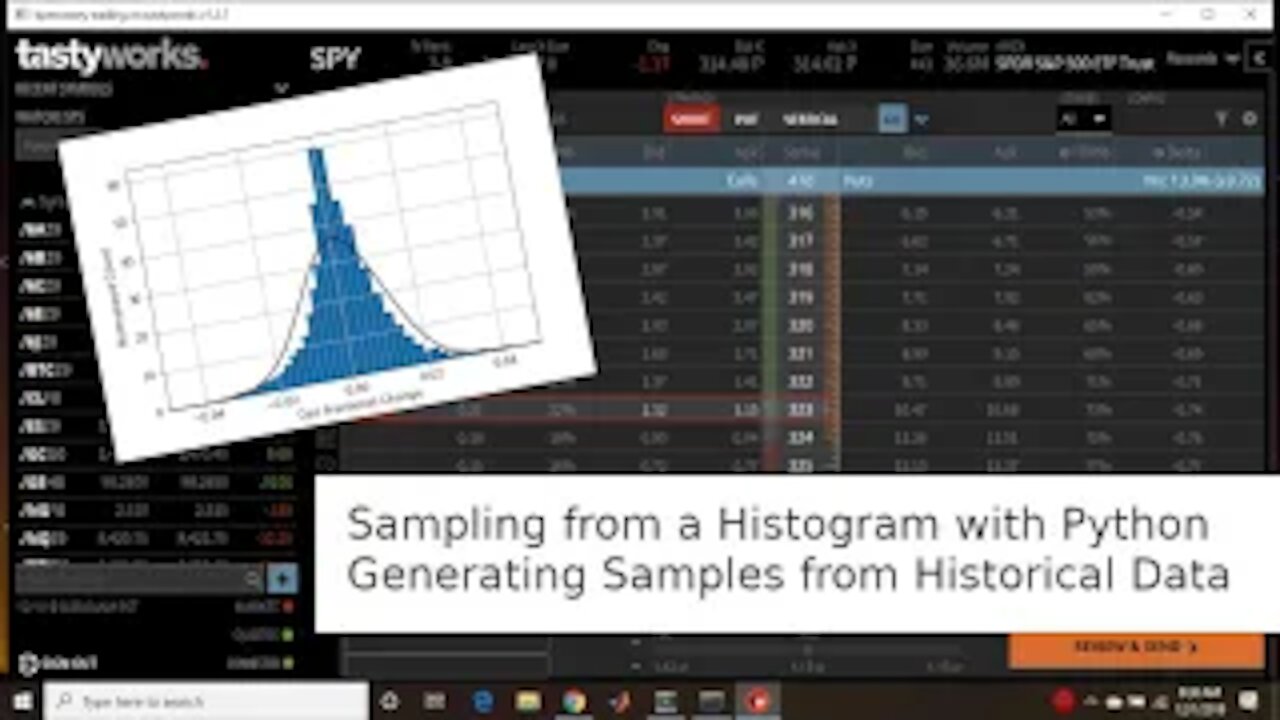
Random Sampling from a Histogram: Using S%P 500 Data
In the last video, we generated a histogram of SPX daily returns. I briefly touched on how to come up with an approximate probability density. I wan to elaborate on that a bit more, and show a very simple way to sample from out custom density function. There are other ways to build an approximate density function, but this is straightforward and probably easier to understand.
As this video is rather basic and doing things as described here depends a lot on how you build the histogram and do the analysis, this will likely be part one of two.
Wikipedia Article: https://en.wikipedia.org/wiki/Inverse_transform_sampling
Github Notebook: https://github.com/kpmooney/numerical_methods_youtube/blob/master/market_analysis/sample_using_cdf.ipynb
Tip Jar: https://paypal.me/kpmooney
-
 0:40
0:40
ViralHog
4 years ago $0.02 earnedRandom Dog Rescued From Raging Flood
2.17K -
 2:13
2:13
KGUN
4 years agoPima County stops landlords from using eviction moratorium loophole
102 -
 1:47
1:47
jeremyseda
4 years ago $0.04 earnedEscaping from a Headlock using Brazilian Jiu-Jitsu
220 -
 5:27
5:27
SportingDog Adventures TV
4 years ago $0.02 earnedMarking Using Reduced Loads from the Gun
77 -
 6:44
6:44
EntertainmentTV2021
4 years agoRandom Logo
159 -
 21:57
21:57
IntentAsh
5 years ago $0.01 earnedRandom News
343 -
 0:47
0:47
Jaim3Rodriguez
4 years agoWhat is a Histogram
21 -
 1:33:29
Statistics Lectures
4 years agoMath10_Lecture_Overview_MAlbert_Ch4_Discrete Random Variables
13 -
 47:03
47:03
Statistics Lectures
4 years agoMath10_Lecture_Overview_MAlbert_Ch5_Continuous Random Variables
11 -
 12:10
12:10
ProgrammingTuts
4 years agoC# Deleting Data From XML File | Part 4
30