Calculating Simple Statistics with Python and Pandas: Stock Market Data
3 years ago
50
A really simple video this time. We use Numpy/Scipy and Pandas to calculate some simple statistics on the daily returns of the S&P 500 index. Specifically, we calculate the mean, standard deviation, skewness, and kurtosis. I also talk about generating a histogram and modifying the plot to represent a density.
Github: https://github.com/kpmooney/numerical_methods_youtube/tree/master/market_analysis
Tip Jar: https://paypal.me/kpmooney
Loading comments...
-
 13:53
13:53
kpmooney
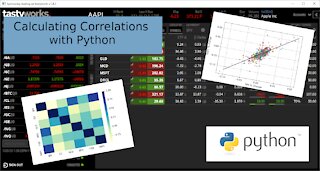
3 years agoCalculating the Correlations Between Stocks Using Python
51 -
 30:12
30:12
kpmooney
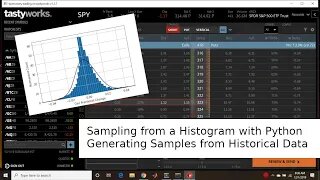
3 years agoRandom Sampling from a Histogram: Using S%P 500 Data
15 -
 20:16
20:16
mokv300
1 year agoStatistics For Data Science | Data Science Tutorial
1191 -
 17:43
17:43
CODETRADING
1 year agoTrading Analysis Using Python
57 -
 15:51
15:51
AIandMLFundamentas
8 months agoData Science RoadMap Part 1: Math, Statistics and Programming Language
6 -
 21:57
21:57
Joram Mutenge
5 months agoPython Polars Tutorial (Part 10): Working with Dates and Time Series Data
18 -
 16:08
16:08
mokv300
1 year agoTop 5 Python Libraries For Data Science | Python Libraries Explained | Python Tutorial
18 -
 2:13:06
infosectrain01
1 year agoData Frames in Pandas | Data Visualization | Basic Statistical Concepts
4 -
 3:43
3:43
Python Programming
1 year agoFind Average Number In Python- Free Python Course
29 -
 19:06
19:06
gvol
1 year ago $0.02 earnedUsing Pandas | Python Tutorial
46