Mean - Pie Graph - Bar Graph - IntoMath
4 years ago
365
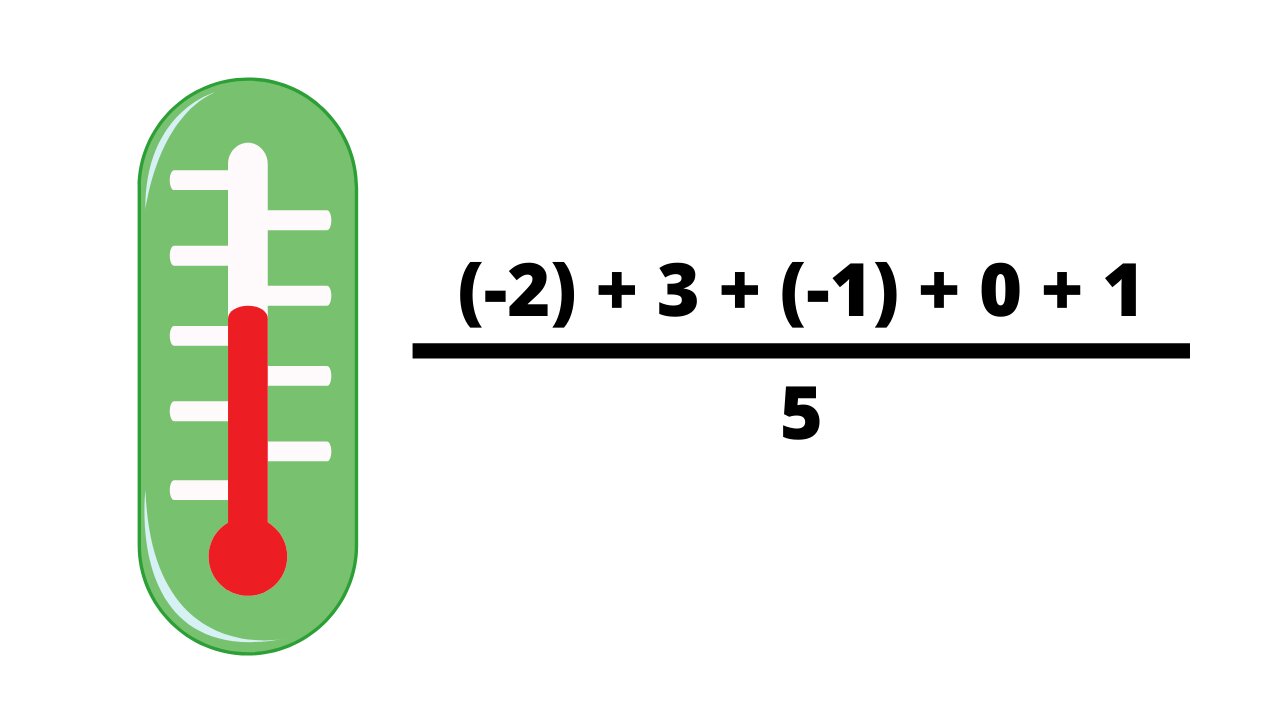
In this lesson you will learn what a mean is.
You will discover how the mean is related to the average.
For example, given a set of numbers: 2, 5, 7, 7, 8 the mean is calculated by first finding the sum of all numbers and dividing the sum by how many numbers there are in a set: (2 + 5 + 7 + 7 + 8)/ 5.
The mean is often used in research, academics and in sports.
You often see these graphs used by media to show the relationships between various quantities ( for example, during the elections, bar or pie graphs are used to show the ratings of the candidates.
You will learn how to use bar graphs when representing the relationships between quantities that are not dependent on each other.
More free math help and activities: intomath.org
Loading comments...
-
 13:15
13:15
IntoMath Grade 10 Lessons
4 years ago $0.01 earnedQuadratic function and its graph explained - IntoMath
189 -
 4:48
4:48
IntoMath Grade 6 Lessons
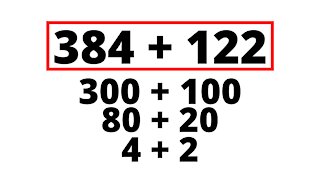
4 years ago $0.04 earnedDecimals - Place value - IntoMath
3001 -
 3:20
3:20
IntoMath Grade 5 Lessons
4 years ago $0.05 earnedDecimals and their properties - IntoMath
2251 -
 6:17
6:17
IntoMath Grade 6 Lessons
4 years ago $0.05 earnedDividing decimals - Metric units - IntoMath
357 -
 3:56
3:56
IntoMath Grade 5 Lessons
4 years ago $0.14 earnedNumbers up to 1000 - IntoMath
381 -
 5:28
5:28
IntoMath Grade 9 Lessons
4 years ago $0.63 earnedSolving equations with brackets - IntoMath
1.24K -
 6:19
6:19
IntoMath Grade 9 Lessons
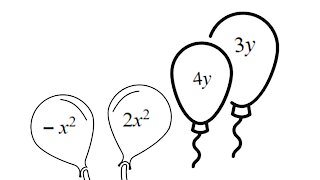
4 years ago $1.76 earnedPolynomials - Collecting like terms - IntoMath
2.32K -
 4:31
4:31
IntoMath Grade 5 Lessons
4 years ago $0.12 earnedSimple Fractions - Same Denominator - IntoMath
212 -
 4:54
4:54
IntoMath Grade 6 Lessons
4 years ago $0.17 earnedEquivalent Fractions - Comparing Fractions - IntoMath
366 -
 5:47
5:47
IntoMath Grade 5 Lessons
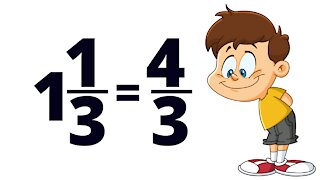
4 years ago $0.51 earnedImproper Fractions - Mixed Numbers - IntoMath
8171