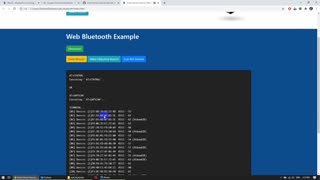
Plotting real-time graph from Bluetooth 5.0 device to Google Chrome
3 years ago
65
utorial on how to plot a real-time graph of values to Google Chrome from Hibou Air Quality Monitor using BleuIO and javascript library chartjs. For this project, I am using Bluetooth Low Energy USB dongle called BlueIO, which will act as a central device to retrieve data. Hibou Air Quality Monitor which will serve as a peripheral device to transmit the data. Source script
https://github.com/smart-sensor-devices-ab/Web-Hibou-Sensor-Plotter
BlueIO
https://www.bleuio.com/
Hibou Air Quality Monitor
https://www.hiboucloud.com/
Loading comments...
-
 2:24
2:24
bleuio
3 years ago $0.01 earnedConnect to Bluetooth device using Google Chrome with BleuIO
57 -
 0:57
0:57
KERO
3 years agoTechBytes: Microsoft outage, new Google device
19 -
 0:54
0:54
Just the News
3 years agoMalicious spyware campaign targeted at Google chrome extensions
15.2K -
 1:03
1:03
Digital Trends
3 years agoGoogle will pull ads from covid conspiracy posts
687 -
 1:01
1:01
Newsy
3 years agoGoogle, Apple Remove Fortnite From Their App Stores
2.01K -
 1:03
1:03
Digital Trends
3 years agoGoogle employees to work from home until July 2021
140 -
 1:41
1:41
NicholasAndBrandon
4 years ago $0.01 earnedHow to set up a Netflix Party on Google Chrome
7.94K1 -
 0:12
0:12
Snipermike253
3 years agoBluetooth hose
48 -
 0:49
0:49
Newsy
3 years agoGoogle To Stop Responding Directly To Data Requests From Hong Kong
1.26K -
 42:17
42:17
CarlCrusher
1 day agoSkinwalker Ranch Ancient Relic Artifacts - Part 6
35.3K11