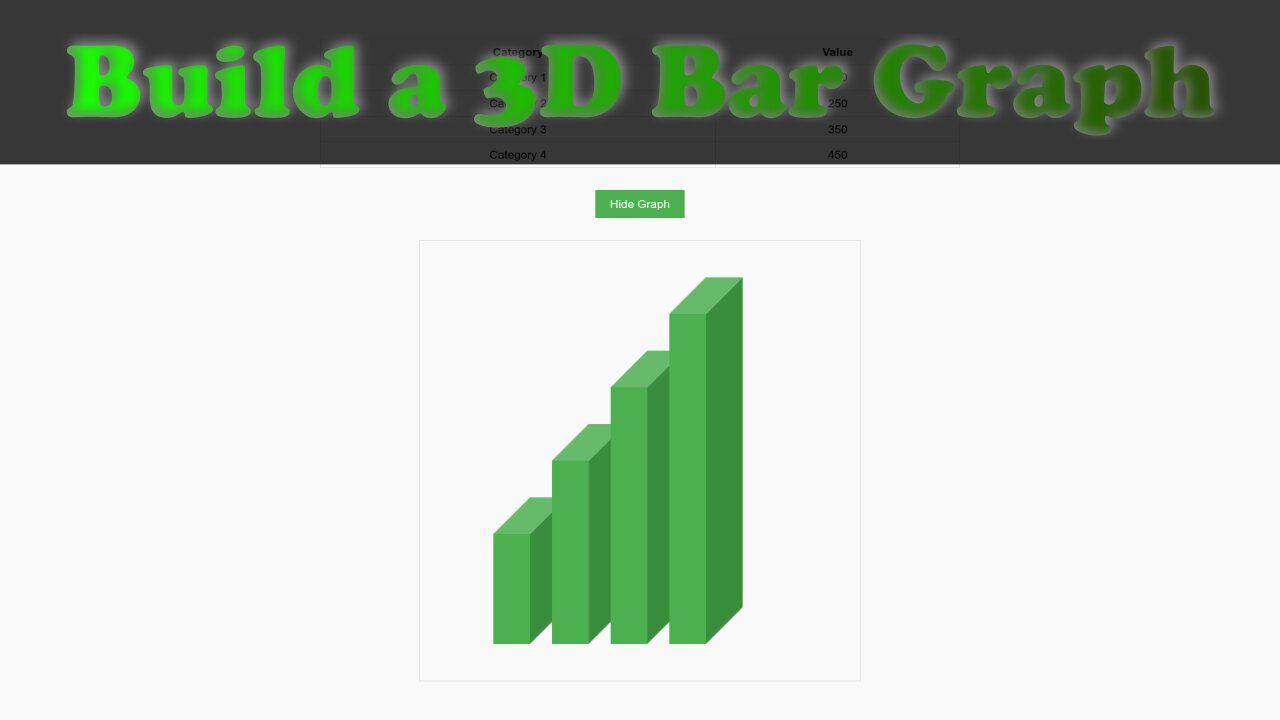
Create Stunning 3D Bar Graphs with HTML5 and JavaScript | Full Tutorial
In this video, I will show you how to build a 3D bar graph from scratch using HTML5 and JavaScript. This beginner-friendly tutorial will guide you through creating interactive and dynamic 3D bar graphs that can be used for data visualization on any website.
By the end of the screencast, you'll have a working 3D bar graph created with the HTML5 canvas element, and you'll learn how to manipulate it using JavaScript. Whether you're new to web development or looking to level up your skills, this video will teach you key concepts in data visualization and 3D rendering for the web.
Check out these additional resources to deepen your understanding:
Blog Article: Learn how to build this 3D bar graph step-by-step:
https://ojambo.com/build-an-html5-3d-bar-graph
My Book: Learning JavaScript - A beginner's guide to JavaScript:
https://www.amazon.com/Learning-JavaScript-Programming-Beginner-Guide/dp/B0DRDB2P2P
My Course: Learning JavaScript - Take your JavaScript skills to the next level with hands-on lessons:
https://ojamboshop.com/product/learning-javascript
One-on-One Programming Tutorials: Get personalized help with JavaScript and other programming topics:
https://ojambo.com/contact
Don't forget to like, comment, and subscribe for more web development tutorials and programming tips!
-
 39:07
39:07
OjamboShop
4 days agoHow to Self-Host Shlink with Podman: Complete Step-by-Step Guide
72 -
 18:07
18:07
MetatronCore
4 hours agoAmala Ekpunobi is BASED
5.27K4 -
 1:01:48
BonginoReport
5 hours agoWaddle & Gobble Receive Presidential Pardons! - Nightly Scroll w/ Hayley Caronia (Ep.185)
101K31 -
 53:41
53:41
Katie Miller Pod
3 hours agoMike & Kelly Johnson on Marriage, Family, & Demands of the Job | The Katie Miller Podcast Ep. 16
21.8K14 -
 1:31:04
The Daily Signal
5 hours ago $3.94 earned🚨BREAKING: Judicial CHAOS—$7 Million Somalian Fraud Scandal Thrown Out, Trans Terrorist Released
16.8K10 -
 9:07:11
GritsGG
11 hours ago#1 Most Warzone Wins 4049+!
18.1K2 -
 1:05:43
TheCrucible
5 hours agoThe Extravaganza! EP: 65 (11/25/25)
109K14 -
 7:29:53
The Rabble Wrangler
18 hours agoBattlefield 6 Free Week | Come Play With The Best in the West!
15.8K -
 1:35:57
Kim Iversen
5 hours agoThe Macrons Tried To KILL Candace Owens?
48.8K106 -
 1:15:59
vivafrei
8 hours agoKash interview - 27 Minutes of No Answers! Another Soft-on-Crime Catastrophe! Pedo Coach? & MORE
186K102