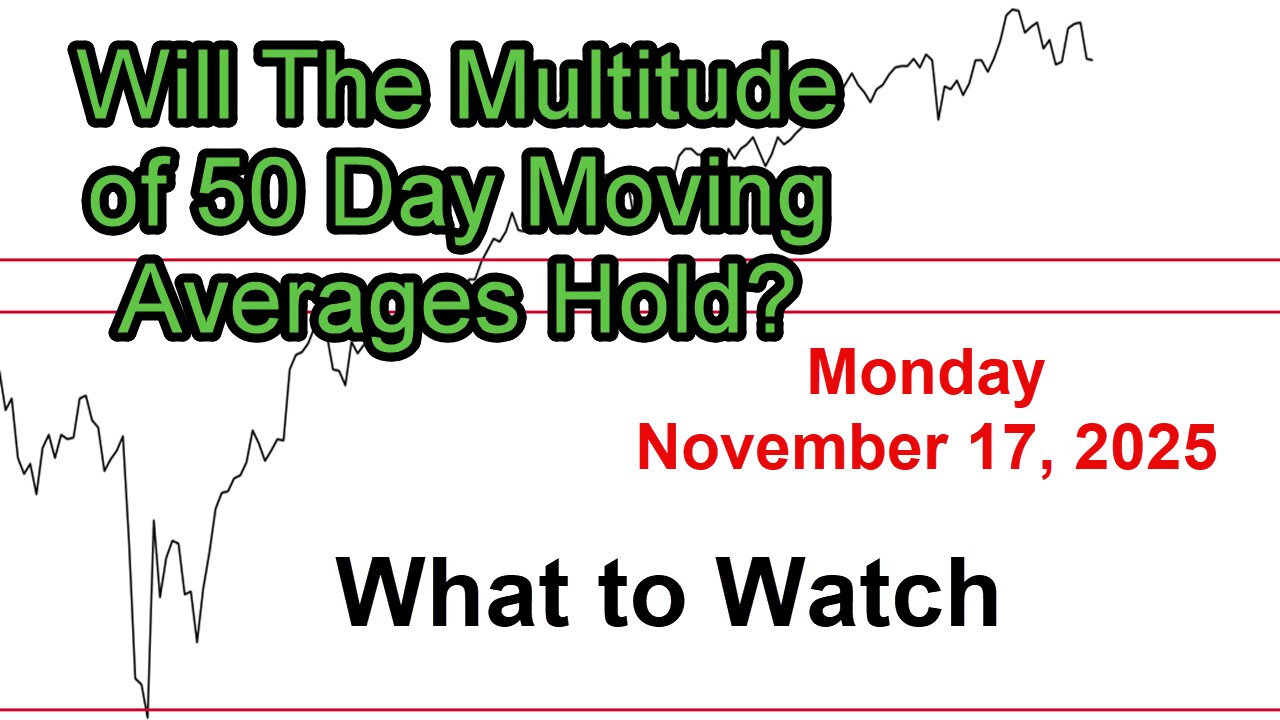
What to Watch Update for Monday November 17, 2025
Link to The SPX Investing Program https://spxinvesting.substack.com
Link to The Daily Pivot Newsletter: https://thedailypivotnewsletter.substack.com/
Link to Video-Only Immediate Access:
https://spxvideos.substack.com/
What to Watch Video Update for Mon, Nov 17, 2025:
Big Picture:
S&P 500: Flat week, closed above 50-day MA despite opening below on Friday.
Key Question: Will multiple 50-day MAs (S&P, NASDAQ, etc.) hold as support this week?
Market short-term vulnerable, but intermediate/long-term still positive.
Shift to value accelerating; growth under pressure.
POSITIVES:
S&P 500: Slight up week; closed above 50-day MA.
Dow: New all-time high Wed (above 48K); well above 50-day.
Broad Market (Wilshire, TOTAL): Just above 50-day.
NASDAQ / QQQ: Above 50-day (but below 20-day).
FANG Index: Sitting on 50-day – holding.
Weekly Parabolic SAR: Dots below price → bullish.
Percent of Stocks above 200-day MA. 57.8% → still positive
Stock/Bond Ratios: Growth still favored long-term. Breadth (10-day avg highs/lows), Improving above 50.
Seasonality: Nov/Dec historically strong.
NEGATIVES:
Short-Term Trend: Below 20-day MA; bow-tie bearish. Percent Stocks above 20/50/100-day MA. All below 50% and declining.
Growth vs Value: Value outperforming; ratios breaking down. Mid/Small Caps below 50-day MAs. Financials vs S&P long-term downtrend (topped in Aug). ARKK FinTech ETF Ratio below 200-day → confirming financial weakness.
VIX: Near 20; any close above = bearish
Sentiment: AAII bearish; Investors Intelligence weakening but still positive.
McClellan Oscillator: Below zero (price & volume).
Bullish Percent Indexes: (S&P, NYSE, NDX). Below 50 & falling
Bitcoin: Below $100K; 50-day below 200-day → downtrend. Bitcoin-NASDAQ 100 Correlation High → BTC weakness may drag tech.
WATCHING CLOSELY:
50-day MAs. Critical support across S&P, NASDAQ, Qs, SMH, etc.
Volume: Light on bounces; heavy on Thursday sell-off.
10-Year Yield: Rising post-Fed; now 4.15%
Dollar (DXY): Daily downtrend, but weekly golden cross forming → watch 100.
Inflation Fear: Low (bond ratios flat).
Hindenburg Omen: Confirmed cluster (Oct 10 + Nov) → rare, worth monitoring.
Oil: $59 – geopolitical watch.
Takeaway: “Did Friday’s bounce off the 50-day MA do enough? Or are we teasing before a breakdown?”
Short-term = vulnerable
Intermediate = testing support
Long-term = still bullish
Focus this week:
Hold 50-day MAs → possible rebound
Break & close below → deeper correction likely.
PDF of Slides:
https://drive.google.com/file/d/18RKyLek_z-9ENAmu4uoyaQmQLeOCrzEp/view?usp=sharing
DISCLAIMER This video is for entertainment purposes only. I am not a financial adviser, and you should do your own research and go through your own thought process before investing in a position. Trading is risky!
-
 5:29
5:29
The SPX Investing Program
2 days agoDaily Update Podcast for Thursday November 20, 2025
31 -
 1:12:53
Wendy Bell Radio
5 hours agoPet Talk With The Pet Doc
18.8K19 -
 LIVE
LIVE
CHiLi XDD
35 minutes agoFF7 Remake | Materia Hunting at its finest!
106 watching -
 33:49
33:49
SouthernbelleReacts
19 hours ago $0.08 earnedNOT THE GOPHER 😭🤣 | First Time Watching Caddyshack
7.53K1 -
 26:19
26:19
marcushouse
3 hours ago $1.23 earnedStarship Super Heavy Just Blew Itself Apart! 🤯 What Happened Here!?
12.6K6 -
 29:27
29:27
JohnXSantos
19 hours agoHow To Start a CLOTHING BRAND on a BUDGET! ($100) Step X Step Guide
1.91K2 -
 3:07
3:07
Memology 101
12 hours ago $0.23 earnedImagine having the AUDACITY to defend this SH*T...
11.8K17 -
 11:13
11:13
MattMorseTV
19 hours ago $51.71 earnedRINO PLOT just got SHUT DOWN.
62.3K155 -
 31:07
31:07
Camhigby
3 days agoLeftist Claims Gender Goes By Identity, Then FLOUNDERS When Asked This Question!
163K90 -
 LIVE
LIVE
Shield_PR_Gaming
5 hours ago11/22/25 I Let's Level up on Battlefield and other games as well!
183 watching