Mapping steller Polka dots
Scientists have devised a new method for mapping the spottiness of distant stars by using observations from NASA missions of orbiting planets crossing their stars’ faces. The model builds on a technique researchers have used for decades to study star spots.
By improving astronomers’ understanding of spotty stars, the new model — called StarryStarryProcess — can help discover more about planetary atmospheres and potential habitability using data from telescopes like NASA’s upcoming Pandora mission.
NASA’s TESS (Transiting Exoplanet Survey Satellite) and now-retired Kepler Space Telescope were designed to identify planets using transits, dips in stellar brightness caused when a planet passes in front of its star.
These measurements reveal how the star’s light varies with time during each transit, and astronomers can arrange them in a plot astronomers call a light curve. Typically, a transit light curve traces a smooth sweep down as the planet starts passing in front of the star’s face. It reaches a minimum brightness when the world is fully in front of the star and then rises smoothly as the planet exits and the transit ends.
By measuring the time between transits, scientists can determine how far the planet lies from its star and estimate its surface temperature. The amount of missing light from the star during a transit can reveal the planet’s size, which can hint at its composition.
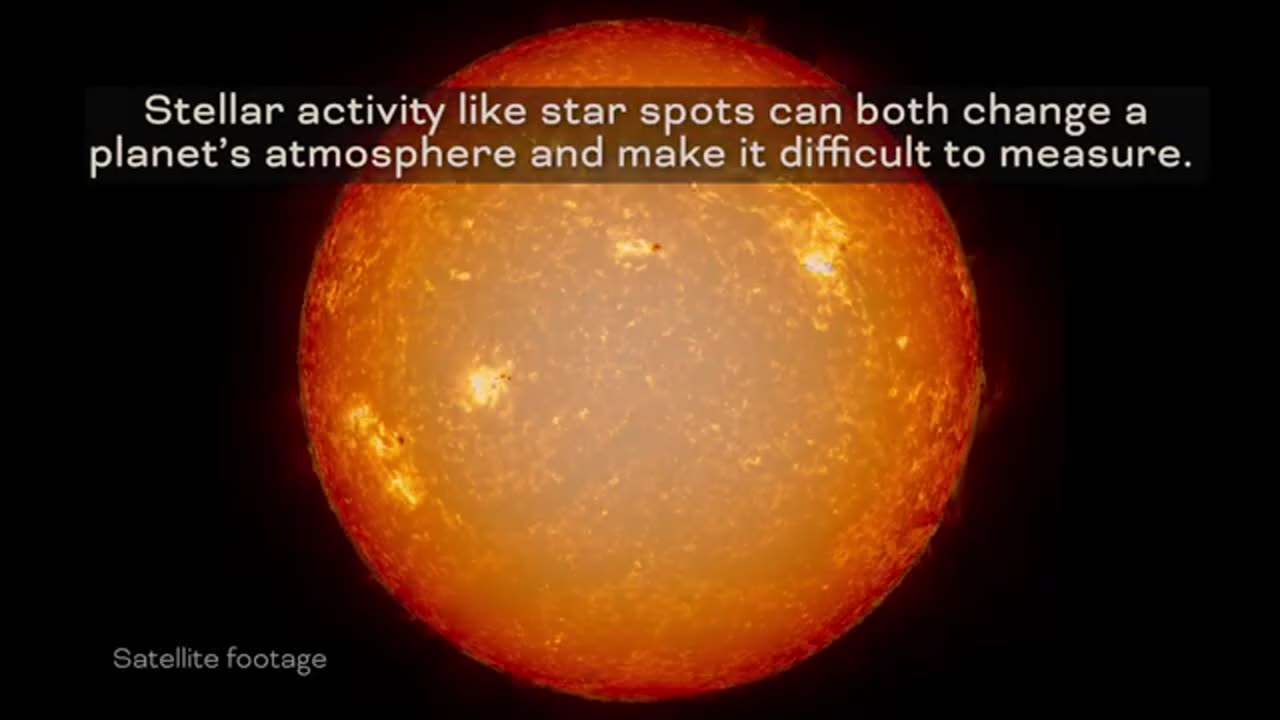
Every now and then, though, a planet’s light curve appears more complicated, with smaller dips and peaks added to the main arc. Scientists think these represent dark surface features akin to sunspots seen on our own Sun — star spots.
The Sun’s total number of sunspots varies as it goes through its 11-year solar cycle. Scientists use them to determine and predict the progress of that cycle as well as outbreaks of solar activity that could affect us here on Earth.
Similarly, star spots are cool, dark, temporary patches on a stellar surface whose sizes and numbers change over time. Their variability impacts what astronomers can learn about transiting planets.
Scientists have previously analyzed transit light curves from exoplanets and their host stars to look at the smaller dips and peaks. This helps determine the host star’s properties, such as its overall level of spottiness, inclination angle of the planet’s orbit, the tilt of the star’s spin rotation axis compared to our line of sight, and other factors. The new model uses light curves that include not only transit information, but also the rotation of the star itself to provide even more detailed information about these stellar properties.
Music credit: “Whimsical Whirlwinds,” Claire Leona Batchelor [PRS], Universal Production Music
Credit: NASA’s Goddard Space Flight Center
Producer: Scott Wiessinger (eMITS)
Science Writer: Jeanette Kazmierczak (University of Maryland College Park)
Animators: Scott Wiessinger (eMITS)
Walt Feimer (eMITS)
Jonathan North (eMITS)
This video can be freely shared and downloaded at https://svs.gsfc.nasa..... While the video in its entirety can be shared without permission, the music and some individual imagery may have been obtained through permission and may not be excised or remixed in other products.
-
 19:24
19:24
Tactical Advisor
18 days agoFolding EDC Axe | CRKT Provoke X
10.4K1 -
 18:54
18:54
T-SPLY
17 hours agoDHS Sending More Federal Agents to Chicago - Pritzker Has Meltdown!
11.8K6 -
 1:17:19
LIVE WITH CHRIS'WORLD
13 hours agoTHE WAKE UP CALL - 11/13/2025 - Episode 5
12.3K4 -
 2:05:11
BEK TV
1 day agoTrent Loos in the Morning - 11/13/2025
14.3K -
 14:34
14:34
Lady Decade
20 hours ago $1.09 earnedSolving The Mystery of the Illegal Star Trek Console - Gaming History Secrets
12.8K8 -
 LIVE
LIVE
The Bubba Army
23 hours agoWHAT's NEW IN THE EPSTEIN FILES? - Bubba the Love Sponge® Show | 11/13/25
1,216 watching -
 30:24
30:24
ZeeeMedia
15 hours agoTrump Exonerated in New Epstein Drop? Intel Assets Infiltrating Media | Daily Pulse Ep 142
20K14 -
 2:10:48
The Robert Scott Bell Show
22 hours agoDr. Andrew Wakefield, Vax Truth Vindication, Del Bigtree, An Inconvenient Study, Jeffrey Tucker, Health Freedom Hoax Exposed - The RSB Show 11-12-25
37.8K7 -
 17:22
17:22
Actual Justice Warrior
1 day agoDemocrats TURN ON Chicago Mayor
21.2K21 -
 14:16
14:16
Nate The Lawyer
1 day ago $4.49 earnedSupreme Court Could Force Trump to Repay All Tariffs | Lawyer Explains
24.5K21