Premium Only Content

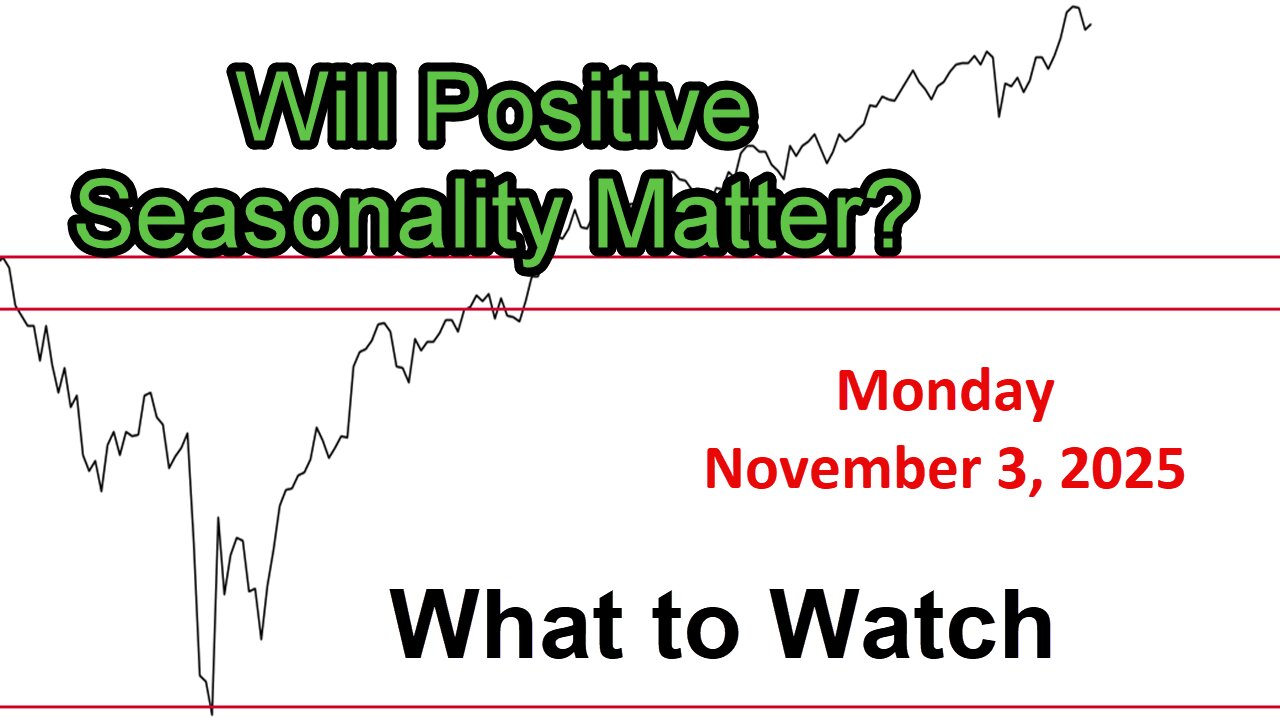
What to Watch Update for Monday November 3, 2025
Link to The SPX Investing Program https://spxinvesting.substack.com
Link to The Daily Pivot Newsletter: https://thedailypivotnewsletter.substack.com/
Link to Video-Only Immediate Access:
https://spxvideos.substack.com/
Summary: Weekend "What to Watch" S&P 500 Update:
Overall Context: S&P 500 posted an up week but surrendered most early gains after Fed Chair Jerome Powell cast doubt on a December rate cut (previously about 90% priced in).
Marketa are now shifting expectations to January.
Internal weakness emerging, but bigger-picture trend remains bullish.
Positive seasonality (Nov–Dec historically strong) could still drive gains, though market may “throw a curveball” with near-term doubt.
POSITIVE Signals
Trend & Price: Price above rising 10/20/30-period MAs (daily). Short- & intermediate-term trends still up.
Weekly Point-and-Figure: new X’s, target at 6,900.
Breadth
Percent of stocks above 200-day SMA ticked up Friday, still above 50%.
Advance/Decline line (price & volume) above MA long-term.
Sector Leadership
Semiconductors outperforming Tech. Tech outperforming the Dow (ratios rising).
Large-cap growth/value solid; small-cap growth/value strong.
Risk Appetite
VIX under 20; risk-on/risk-off ratio rising.
High-beta above low-beta.
Momentum: Monthly TTM Squeeze turning light-blue (bullish). Daily/weekly Parabolic SAR, Vortex, Special K all bullish.
Seasonality:
November historically strong (1950–present, post-election years).
NEGATIVE Signals
Sentiment: Investors Intelligence above 4 bears (extreme, contrarian bearish).
Breadth: Percent of stocks above 20/50/100-day MAs all below 50% and declining. Bullish Percent Index (S&P) 50.2%, falling.
New highs contracting, new lows expanding.
Smart Money Indicators:
All 3 indicators (Boom, Chaiken Money Flow, Chaiken Osc) negative.
McClellan Osc & Summation Index (price & volume) declining and below zero.
Sector/Style:
Financials underperforming S&P since spring.
Discretionary/Staples stalling.
Homebuilders at bottom of rainbow after Powell’s comments.
Overextension:
S&P 11.9% above 200-day SMA (above 10% often leads to deeper pullbacks).
WATCH LIST (Neutral / Developing)
Volume: Above-average but tapering late-week.
10-yr Yield: Rebounded to 4.1% post-cut (bearish for rate-sensitive).
VIX/MOVE Ratio: Rising (stock vol greater than bond vol).
Novelty Signals: Mass Index reversal pattern (negative) and Pring Bottom Fisher buy signal (conflicting).
Hindenburg Omen: Confirmed Oct 29 (2 spikes); more spikes suggest higher risk, but not automatic.
Pivot Points: Overhead resistance tested; new support possibly forming.
Other:
Bond spreads stable, inflation expectations low, Europe vs US choppy.
Bottom Line
Bull case: Uptrend, leadership, seasonality, and long-term momentum intact.
Bear case: Overbought, breadth deteriorating, Fed removing dovish certainty.
PDF of Slides:
https://drive.google.com/file/d/1Oq3duYFSE9hdmP6JEmtpccEcfBymE8vw/view?usp=sharing
DISCLAIMER This video is for entertainment purposes only. I am not a financial adviser, and you should do your own research and go through your own thought process before investing in a position. Trading is risky!
-
 48:23
48:23
The SPX Investing Program
2 days agoS&P 500 Daily Update for Friday November 7, 2025
67 -

Barry Cunningham
1 day agoBREAKING NEWS: DID PRESIDENT TRUMP MAKE A HUGE MISTAKE? SOME SUPPORTERS THINK SO!
32.3K15 -
 LIVE
LIVE
SpartakusLIVE
3 hours agoSOLOS on WZ || #1 Challenge MASTER is BACK in Verdansk
382 watching -
 LIVE
LIVE
megimu32
2 hours agoOFF THE SUBJECT: Chill Stream, Music & Fortnite Chaos 🎹🎮
74 watching -
 2:24:09
vivafrei
12 hours agoEp. 290: Canada's Darkest Week; Comey Fix is In! Tariffs, SNAP, Hush Money Win & MORE!
206K146 -
 LIVE
LIVE
EricJohnPizzaArtist
5 days agoAwesome Sauce PIZZA ART LIVE Ep. #68: DDayCobra Jeremy Prime!
241 watching -
 LIVE
LIVE
meleegames
2 hours ago32X Roulette - 30 Years. 32 Games. 32X.
84 watching -
 LIVE
LIVE
SOLTEKGG
1 hour ago(30+ KILL WORLD RECORD) - Battlefield 6
50 watching -
 1:18:00
HELMETFIRE
1 hour ago🟢GAMING WITH FIRE EP15🟢
2.88K -
 LIVE
LIVE
BubbaSZN
2 hours ago🔴 LIVE - FARTNITE W/ @CATDOG & @CHEAP
23 watching