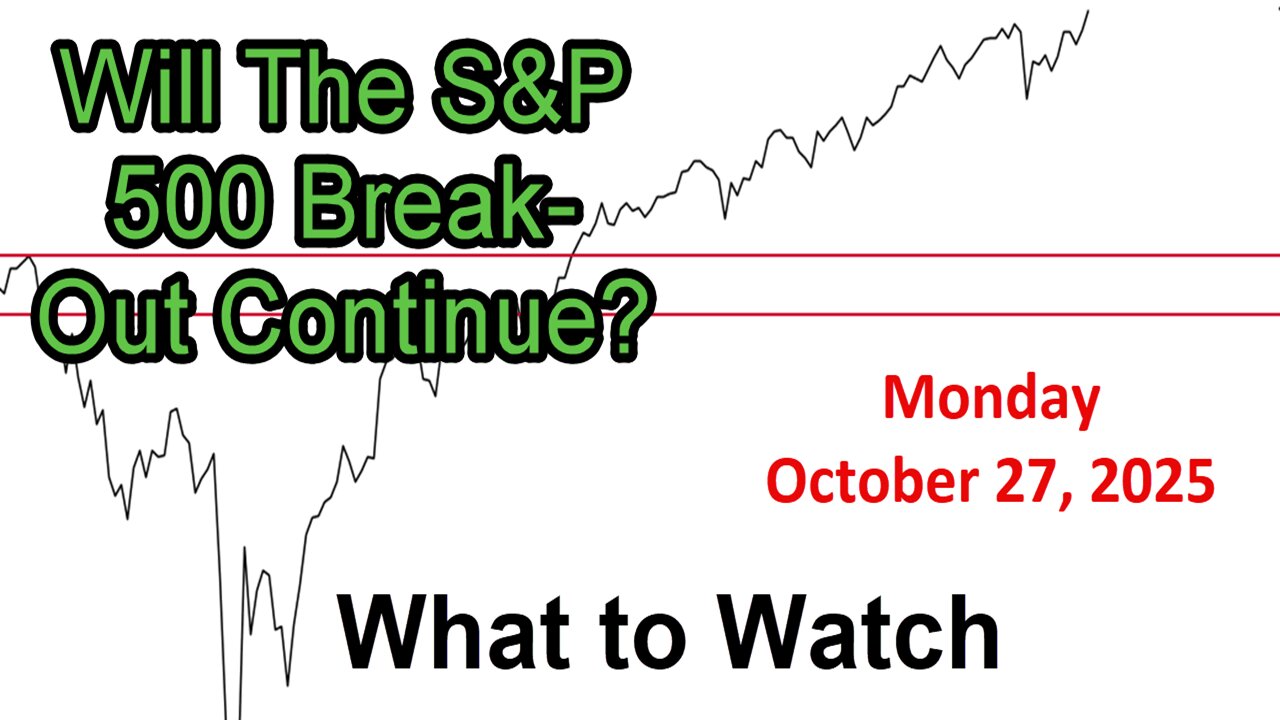
What to Watch Update for Monday October 27, 2025
Link to The SPX Investing Program https://spxinvesting.substack.com
Link to The Daily Pivot Newsletter: https://thedailypivotnewsletter.substack.com/
Link to Video-Only Immediate Access:
https://spxvideos.substack.com/
Summary of "What to Watch" Video Update (Prepared for October 27, 2025)
This video provides a comprehensive analysis of market trends and technical indicators, focusing on daily and weekly charts, with some longer-term perspectives. Market signals are categorized into positive, negative, and areas to monitor, assessing their implications for the S&P 500 and broader market trends.
Key Points
Market Overview
Recent Performance: The S&P 500 has been range-bound since a significant 2.75% drop on October 10, 2025. A breakout occurred on Friday, October 24, following a favorable CPI report, with the S&P 500 up 1.9% for the week. However, the breakout occurred on below-average volume, indicating a lack of strong conviction.
Gap Analysis: A price gap from Thursday to Friday remains unfilled, which may attract market attention in the near term.
Trend Analysis: The S&P 500 is showing signs of improvement, with short- and intermediate-term trends turning positive, though conviction remains weak.
Positive Indicators
Daily Chart: The S&P 500 is near its October pivot point, testing resistance. A breakout above this level could signal further upside.
Sentiment: Sentiment is improving from extreme negative territory, acting as a contrarian indicator with room for further upside before becoming overly bullish.
Technical Indicators:
The "bow tie" pattern (10, 20, 30-period moving averages) shows alignment and upward movement, indicating a positive short-term trend.
The S&P is above its 20, 50, and 200-day moving averages, with all trending upward.
Large-cap growth and value are improving, with some sectors (e.g., semiconductors, tech) outperforming.
The VIX is below 20, suggesting lower volatility and a more positive environment.
Advance-decline lines and bullish percent indices for the S&P, NYSE, and NASDAQ 100 are positive, with some setting all-time highs.
Sector Performance:
Semiconductors (+2.34%) and large-cap growth (e.g., FANG index) are strong, with major indices hitting all-time highs.
Stock-to-bond ratios (e.g., S&P 500 vs. 3-7 year bonds) suggest no immediate recession concerns.
Seasonality: November and December historically show positive seasonality, particularly in post-election years, supporting potential market gains.
Negative Indicators
Volume Concerns: The recent breakout occurred on below-average volume, raising doubts about its sustainability.
Growth-to-Value Ratio: The S&P growth-to-value ratio remains weak, unable to break above its 50-day moving average.
Financial Sector: Continues to underperform the S&P, potentially signaling underlying issues (e.g., fraudulent loans at smaller banks).
Oscillators: Short-term oscillators (e.g., Slope, TSI) are flat or improving but not yet positive. Long-term oscillators remain negative.
Value Line Geometric Index: Unlike major indices hitting all-time highs, this index has not recovered to its 2021 peak, suggesting broader market weakness.
Areas to Monitor
Volume Trends: Continued low volume on up days could undermine the breakout.
Individual Investor Sentiment: Currently bearish, which could be bullish if the market continues upward, but needs confirmation.
Skew Index: Indicates potential market moves, but direction (up or down) is unclear.
10-Year Yield: Dropped to 4%, which is positive for stocks, but sustained declines could signal economic weakness.
Oil and Dollar: Rising oil prices (low 60s) and a potentially strengthening dollar could pressure stocks.
Hindenburg Omen: No confirmed signal yet, but a spike by November 7 could be bearish.
Key Questions:
Can the S&P 500 sustain its breakout above the October 10 range?
Will the Thursday-Friday gap be filled, and if so, when?
Are financial sector weaknesses a precursor to broader issues?
Will positive seasonality and improving technicals drive further gains?
Conclusion:
The S&P 500 is showing positive signs, with a breakout on Friday, improving trends, and favorable seasonality. However, low volume, underperforming financials, and mixed oscillator signals suggest caution. Monitor volume, sentiment, and key ratios (e.g., growth-to-value, stock-to-bond) to gauge the breakout’s strength and potential economic signals.
PDF of Slides:
https://drive.google.com/file/d/1q-di48IrhBwhz_vU2EiOrQe9y2WLII5u/view?usp=sharing
DISCLAIMER This video is for entertainment purposes only. I am not a financial adviser, and you should do your own research and go through your own thought process before investing in a position. Trading is risky!
-
 34:08
34:08
The SPX Investing Program
3 days agoWeekly Update for October 27-31, 2025
67 -

TheCrucible
1 hour agoThe Extravaganza! EP: 62 with Guest Co-Host: Rob Noerr (10/29/25)
17.8K4 -
 LIVE
LIVE
Dr Disrespect
7 hours ago🔴LIVE - DR DISRESPECT - BATTLEFIELD 6 - REDSEC DUOS - WIN WIN WIN
1,369 watching -
 1:42:41
Redacted News
2 hours ago"Their goal is CIVIL WAR in the U.S." Americans Fighting Over SNAP Food Stamps | Redacted News
87.6K71 -
 LIVE
LIVE
Candace Show Podcast
1 hour agoWhy Isn't The Trump Family Asking Questions About Charlie Kirk? | Candace Ep 254
7,425 watching -
 LIVE
LIVE
Nikko Ortiz
28 minutes agoREALISTIC BATTLEFIELD SIMULATOR... |Rumble Live
78 watching -
 33:34
33:34
Stephen Gardner
1 hour ago🔥Democrats are PANICKING after losing this FIGHT!!
2.96K4 -
 LIVE
LIVE
StoneMountain64
4 hours agoBattlefield Battle Royale is BETTER than I expected
96 watching -
 LIVE
LIVE
Viss
8 hours ago🔴LIVE - Viss & Dr Disrespect Dominate Duos In Battlefield RedSec!
110 watching -
 LIVE
LIVE
Red Pill News
2 hours agoNGO’s Caught Funding CCP on Red Pill News Live
3,537 watching