Premium Only Content

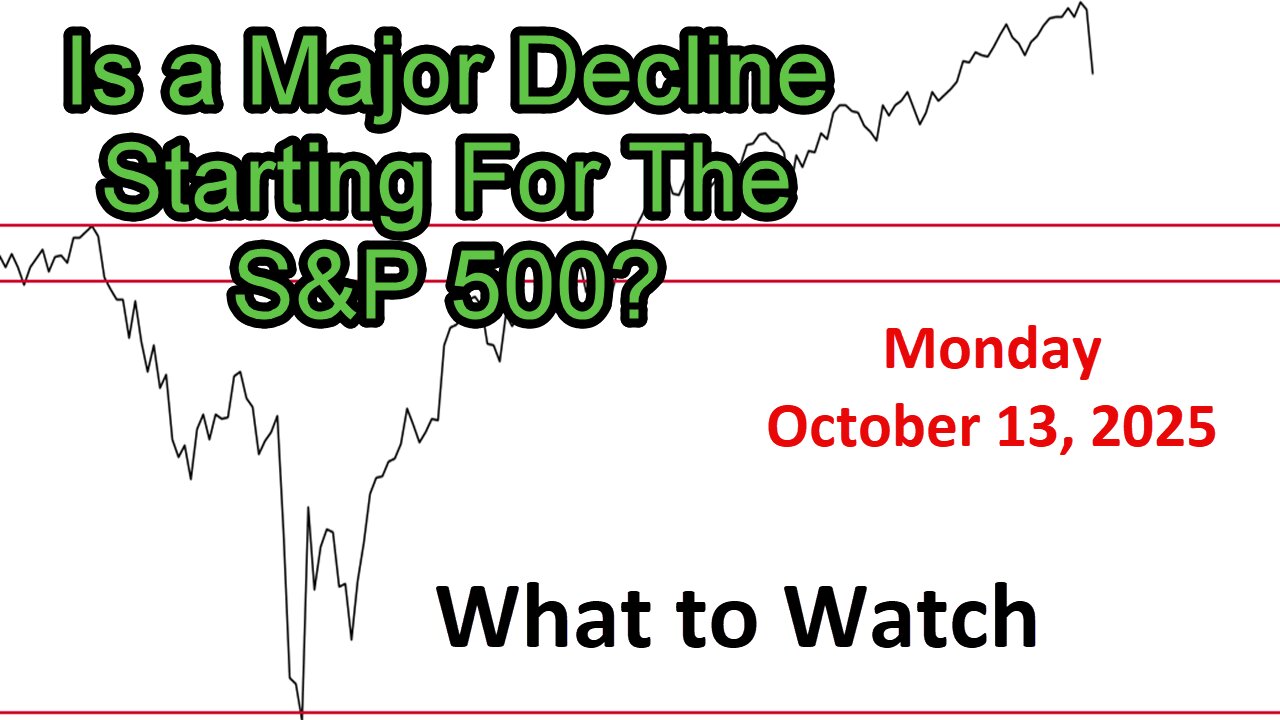
What to Watch Update for Monday October 13, 2025
Link to The SPX Investing Program https://spxinvesting.substack.com
Link to The Daily Pivot Newsletter: https://thedailypivotnewsletter.substack.com/
Link to Video-Only Immediate Access:
https://spxvideos.substack.com/
Summary of the "What to Watch" Video Update
This video is divided into three categories: positive, negative, and areas to watch, with insights derived from technical indicators, market sentiment, and broader economic signals.
Positive Signals
Intermediate-Term Trends: Despite Friday’s decline, the S&P 500 remains above the 50-period moving averages, indicating intermediate-term support is holding for now. This is also seen in other indexes including the NASDAQ, NASDAQ 100, and Wilshire 5000, which are slightly above their 50-day moving averages.
Long-Term Trends: The S&P 500 and other indexes are still in long-term uptrends, with higher highs and higher lows intact. The long-term rainbow (50- to 250-period moving averages) shows no significant breakdown, yet.
Sentiment Indicators: The investor sentiment survey (pre-Friday, October 8) shows a positive but not overly exuberant reading (above 3 but declining slightly), suggesting room for upside before sentiment becomes extreme.
Individual investor sentiment is slightly positive (above zero) but not at levels indicating excessive exuberance (e.g., 30–40), which could imply potential for further gains.
Sector and Ratio Strength:
Financial sector (ARK FinTech, ARKF) and FANG index are above their 50-day moving averages, acting as key support levels.
Growth-to-value ratios (e.g., QQQs to S&P) and semiconductor-to-Dow ratios are still above advancing moving averages.
Weekly Trends: Weekly charts, including the parabolic SAR and trend indicators, remain positive, with the S&P 500 above key support levels.
Market Breadth: The percentage of S&P stocks above their 200-day moving average remains above 50%, and long-term oscillators (e.g., TRIX, KST) are still barely positive.
Negative Signals
Short-Term Breakdown:
The S&P 500 dropped below the 20-period moving average, a level it has held since the April lows, signaling short-term weakness.
Short-term momentum indicators are rolling over, with the vortex indicator showing a bearish crossover (red line above green).
Market Internals:
The percentage of S&P stocks above their 20- and 100-period moving averages has dropped below 50%, indicating broad-based weakness.
Advance-decline lines (S&P, NYSE, mid-caps, small-caps) are declining.
Smart money indicators (e.g., Chaikin Money Flow & Ocillator, accumulation/distribution, boom indicator) are negative in the short term.
Volatility and Sentiment:
The VIX spiked above 20, with the RSI (9-period) above 70, indicating a rapid increase in fear.
The VIX-to-MOVE ratio (stock vs. bond volatility) and VIX-to-VVIX ratio are rising, signaling heightened stock market volatility.
The fear and greed index dropped to negative from neutral.
Sector Weakness:
Discretionary-to-S&P and financial-to-S&P ratios have fallen below their 50-day moving averages.
Growth-to-value ratios (S&P, NASDAQ 100) are turning negative.
Flight to Safety: Interest rates fell due to a flight to safety, with investors selling stocks to buy bonds, pushing bond prices up and yields down, reminiscent of early 2025 declines.
Areas to Watch
Support Levels: Multiple indexes (S&P, Dow, NASDAQ, Wilshire 5000, FANG) are testing or near their 50-day moving averages or pivot points. A close below these levels could signal a more bearish outlook, while holding could lead to a bounce.
Mid-caps (S&P 400) are at an S2 support level but have been underperforming, showing no strong conviction.
Dollar and Yields:
The U.S. dollar is in a downtrend (positive for stocks), but any strength could pressure equities.
Sector Ratios:
Staples-to-tech and utilities-to-S&P ratios spiked on Friday, indicating defensive outperformance. Continued rises could signal increased market caution.
Biotech-to-healthcare looks strong, but hotels-to-utilities and discretionary-to-staples are weakening.
Oil prices are declining (high 50s), which could ease inflationary pressures.
Global Markets:
The S&P-to-German DAX ratio is declining, similar to early 2025, suggesting U.S. underperformance relative to European markets.
Seasonality: Mid-October is historically a strong period, but the second half is less favorable.
Momentum stocks and high-beta-to-low-beta ratios are weakening but remain range-bound.
VIX-to-S&P Correlation: Previously rising, it has now dropped to neutral, which historically precedes declines.
Key Question:
Is a major decline starting for the S&P 500?
PDF of Slides:
https://drive.google.com/file/d/1szIrVxq3tqTUsfpOBeLng1fppMLNp9Iu/view?usp=sharing
DISCLAIMER This video is for entertainment purposes only. I am not a financial adviser, and you should do your own research and go through your own thought process before investing in a position. Trading is risky!
-
 6:01
6:01
The SPX Investing Program
13 hours agoDaily Update Podcast for Wednesday October 15, 2025
29 -
 1:26:01
The Quartering
3 hours agoYoung Republican Smear, Woke Sidewalks Washed Away, Major Changes To X & More
90.2K32 -
 1:36:03
Darkhorse Podcast
3 hours agoThe 296th Evolutionary Lens with Bret Weinstein and Heather Heying
5.18K10 -
 LIVE
LIVE
StoneMountain64
1 hour agoI can't stop playing BATTLEFIELD 6
40 watching -
 1:05:17
Jeff Ahern
2 hours agoNever Woke Wednesday with Jeff Ahern
4.58K2 -
 1:24:59
Sean Unpaved
4 hours agoPrime Pulse: Yamamoto's Gem, Mendoza & Simpson's Title Quest, & NFL QB Rule Shift
23.3K1 -
 2:38:53
The Shannon Joy Show
5 hours agoCharlie Kirk Killing Exploited For Trump’s Everything War - Insurrection Against The Constitution
28.6K15 -
 10:54
10:54
Midwest Crime
4 hours agoTrain Platform Killer Caught on Camera
7.02K1 -
 10:02
10:02
China Uncensored
4 hours agoChina Has LOTS of Regret
12.2K13 -
 30:39
30:39
The Boomer Effect
5 hours agoBurnout Is Not a Badge: Redesign Your Life
4.84K