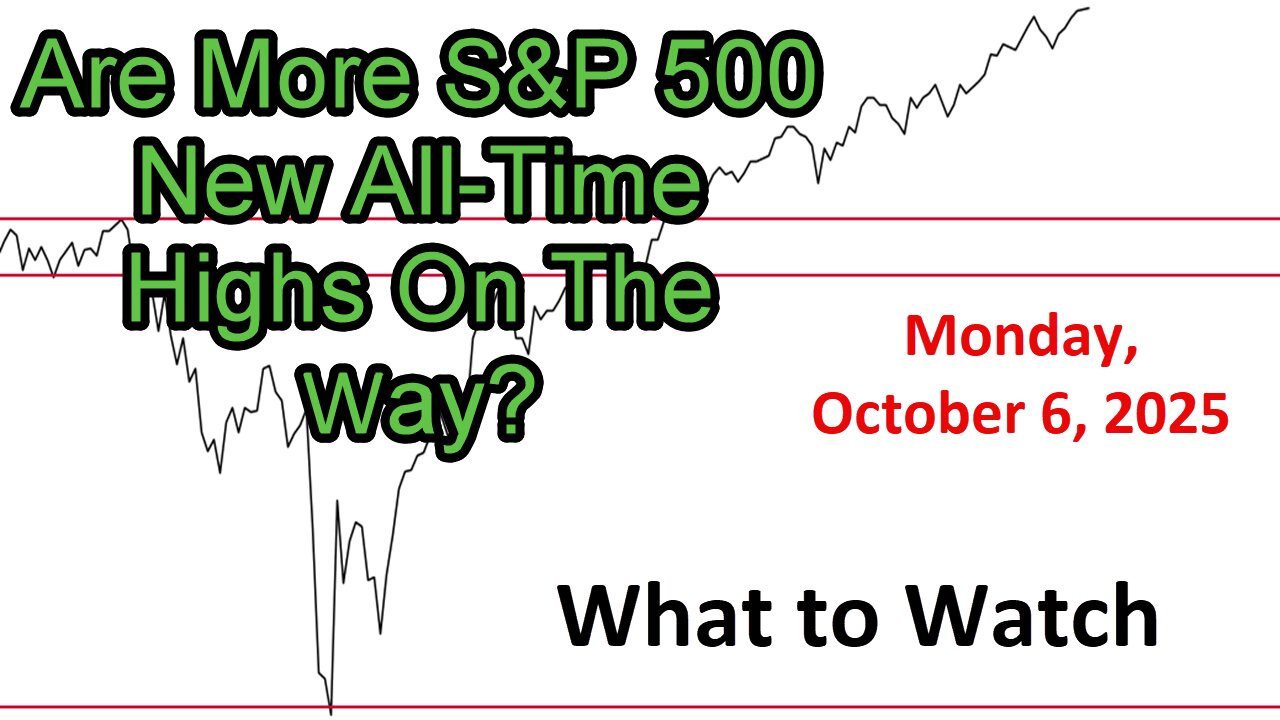
What to Watch Update for Monday October 6, 2025
Link to The SPX Investing Program https://spxinvesting.substack.com
Link to The Daily Pivot Newsletter: https://thedailypivotnewsletter.substack.com/
Link to Video-Only Immediate Access:
https://spxvideos.substack.com/
This is a summary of a "What to Watch" video update, which is a weekly analysis focusing on key market charts categorized into positive, negative, and watch areas. The video addresses whether the S&P 500 will continue reaching new all-time highs, following a week of gains and a government shutdown affecting data releases such as the employment report.
Positive Indicators:
The S&P 500 rose over 1% this week, setting new all-time highs, with late-day buying and follow-through on Wednesday.
The S&P 500 remains in an uptrend, with prices above moving averages, showing higher highs and lower lows.
Growth-to-value ratios (large and mid-cap) are positive, with large-cap growth near all-time highs.
Risk-on indicators (e.g., high beta vs. low beta, discretionary vs. staples) are favorable.
Long-term oscillators including the Special K is positive, and the weekly ADX shows a non-confirmed positive trend.
Advance-decline lines and volume-based indicators show strength, with volume outperforming price.
Stock-to-bond ratios suggest the market does not anticipate a recession, supporting a soft-landing scenario.
Semiconductors and broad market ETFs such as the Wilshire and Total US Stock ETF hit new highs.
Negative Indicators:
The Fear and Greed Index is declining, signaling caution despite room for upside.
VIX-to-S&P correlation and stock-to-bond volatility ratios show rising fear not yet reflected in other indicators.
Growth-to-value ratios weakened on Friday, with value outperforming growth.
Small-cap growth-to-value ratio is nearing a death cross, and small caps are underperforming the S&P.
Financials, particularly regional banks, continue to lag the S&P, though FinTech (ARKF) shows resilience.
Some momentum oscillators (e.g., TTM Squeeze, Coppock Curve) show negative divergences.
Volume dropped below average on Thursday and Friday, hinting at reduced conviction.
Home construction remains weak, though improving with declining 10-year yields.
Watch Areas:
Equity put-call ratios are low but rising, warranting monitoring.
Dow Theory shows non-confirmation, with transports lagging the Dow and utilities.
10-year yields are declining, reducing inflation concerns, but oil prices and retail trends are mixed.
Emerging markets are losing momentum to developed markets, and the US dollar is in a downtrend.
Seasonality favors the first half of October, but the second half typically underperforms.
The S&P 500 remains optimistic, driven by no recession fears and expected Fed rate cuts, but mixed signals and the government shutdown introduce uncertainty. The focus is on whether the S&P 500 can sustain its upward momentum toward 7,000.
PDF of Slides:
https://drive.google.com/file/d/1EgKjNoV7qZy51-DjYfi_02ET4BHlboGO/view?usp=sharing
DISCLAIMER This video is for entertainment purposes only. I am not a financial adviser, and you should do your own research and go through your own thought process before investing in a position. Trading is risky!
-
 6:12
6:12
The SPX Investing Program
2 days agoDaily Update Podcast for Friday October 3, 2025
27 -
 2:23:58
Nerdrotic
3 hours ago $3.00 earnedDeDunking the Debunkers with Dan Richards | Forbidden Frontier #119
12.8K5 -
 LIVE
LIVE
EricJohnPizzaArtist
6 days agoAwesome Sauce PIZZA ART LIVE Ep. #64: Robbie “The Fire” Bernstein
246 watching -
 LIVE
LIVE
GritsGG
6 hours agoWarzone Win Grinding! Most Wins in WORLD! 3680+!
141 watching -
![[LIVE] STAR WARS: Jedi Academy - Movie Battles 2 | ReaperAF95's Community Event Day 2](https://1a-1791.com/video/fwe2/ce/s8/1/E/Q/f/o/EQfoz.0kob-small-LIVE-STAR-WARS-Jedi-Academy.jpg) LIVE
LIVE
Joke65
3 hours ago[LIVE] STAR WARS: Jedi Academy - Movie Battles 2 | ReaperAF95's Community Event Day 2
41 watching -
 5:41:09
Right Side Broadcasting Network
2 days agoLIVE REPLAY: President Trump to Deliver Remarks at America's Navy 250 in Norfolk, VA - 10/5/25
114K65 -
 LIVE
LIVE
SynsFPS
4 hours ago🔴B07 Beta🔴|🔴 LEVEL CAP INCREASED 🔴|🔴Path to Verify 🔴
91 watching -
 LIVE
LIVE
tminnzy
4 hours ago*BETA DROPS* BO7 LEVEL CAP INCREASE! OPEN BETA
139 watching -
 1:06:42
The White House
5 hours agoPresident Trump Delivers Remarks at Navy 250 Celebration
36.8K47 -
 4:42:13
TinyPandaface
5 hours agoYour FACE is a Gaming Channel! | Homebody
15.3K
