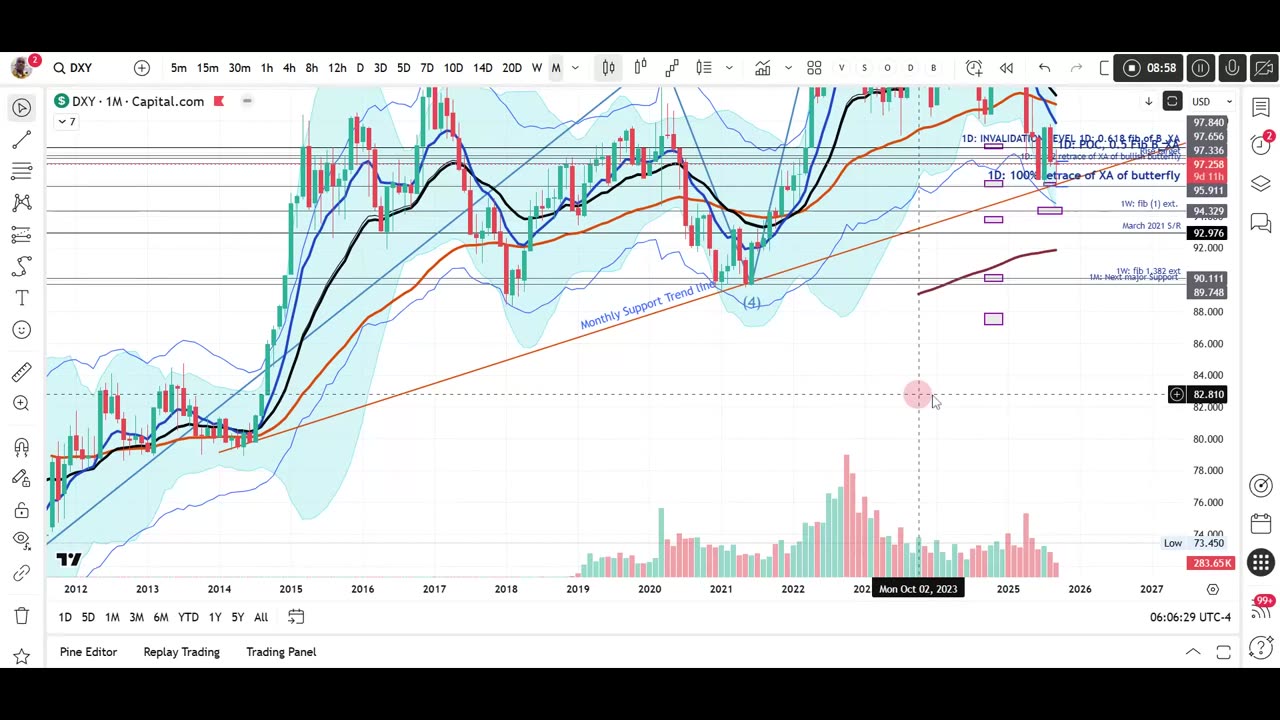
MIXED SIGNALS ON THE DOLLAR INDEX
The dollar index has beautifully retraced 100% of a bearish Butterfly pattern that was identified between July 1st and August 13th 2025, hitting the monthly support target of 95.911. There has been a strong bounce from this support zone into the weekly closing range.
What we currently have now is also a bullish Butterfly pattern on the daily chart and the bounce from the support zone has retraced to exactly the 0.382 fib level (97.336). The weekly hammer candle suggests that bulls will attempt to reach the 0.5 fib level, however lower time frames shows that the bulls are losing their strength. As such, I am not expecting DXY to continue grinding up next week without a major pullback to retest the weekly candle wicks. Basically expecting a lot of volatility in both directions.
I thank you for checking out my publication and I wish you a successful trading week. Cheers!!
5 days ago
Trade active
DXY pullback towards my target and that forms a higher low on the chart. This higher low has now gone to break the resistance at 97.500 to the 0.5 fib. I will be observing if the 97.5 level holds support into the weekend. If this holds, the floor for DXY is found and looking Bullish from here. This is not a great setup for selling the dollar.
-
 31:05
31:05
Liberty Hangout
1 day agoAnti-Fascists Can't Define Fascism
31.5K70 -
 2:35:27
FreshandFit
4 hours agoThe Biggest Debt Problem in America
82.7K8 -
 2:10:56
Inverted World Live
7 hours agoRobot Holocaust | Ep. 123
63.7K6 -
 3:22:33
Laura Loomer
6 hours agoEP149: Trump Frees the Hostages: Will HAMAS Respect the Ceasefire?
54.8K27 -
 1:02:02
The Nick DiPaolo Show Channel
7 hours agoTrump’s Success Rattling Lefties | The Nick Di Paolo Show #1804
25.7K25 -
 2:49:33
TimcastIRL
7 hours agoDemocrat Call On Liberals To 'FORCEFULLY RISE' Against Trump, DHS ATTACKED In Chicago | Timcast IRL
230K108 -
 2:50:07
Badlands Media
13 hours agoDEFCON ZERQ Ep. 013
52.8K57 -
 6:21:11
SpartakusLIVE
8 hours agoLIVE from SUPER SECRET, VIP Location || BEACH FRONT into Verdansk
71.4K7 -
 1:20:01
Flyover Conservatives
1 day ago"The Testosterone Levels of a Baby Bird" - America’s Health Crisis w/ Dr. Troy Spurrill | FOC Show
41.6K1 -
 2:28:15
PandaSub2000
1 day agoSonic Racing CrossWorlds | ULTRA BESTIES & GAMES (Original Live Version)
26.2K1