Premium Only Content
This video is only available to Rumble Premium subscribers. Subscribe to
enjoy exclusive content and ad-free viewing.

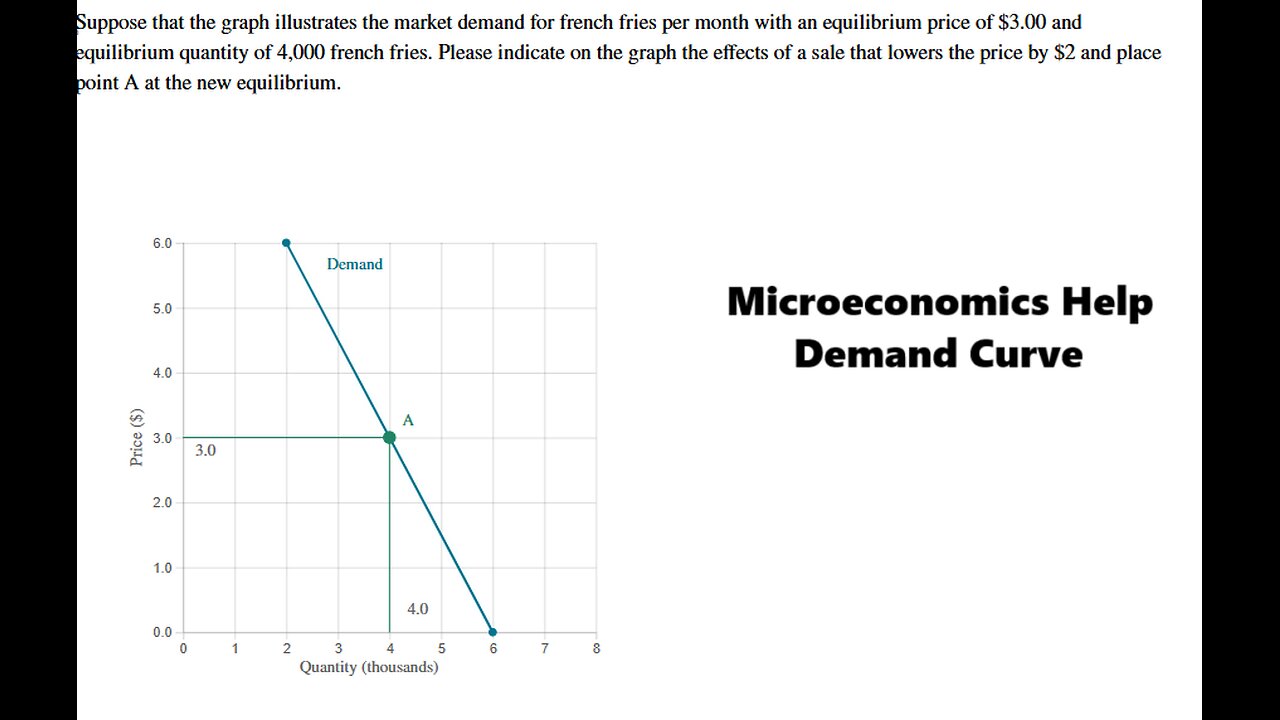
Microeconomics Help: Suppose that the graph illustrates the market demand for french fries per month
26 days ago
7
Suppose that the graph illustrates the market demand for french fries per month with an equilibrium price of $3.00 and equilibrium quantity of 4,000 french fries. Please indicate on the graph the effects of a sale that lowers the price by $2 and place point A at the new equilibrium.
#MicroeconomicsHelp
#Microeconomics
#Techniques
#DemandCurve
Loading comments...
-
 1:08:55
vivafrei
22 hours agoExposing the Trans MADNESS in Maine School Boards! Live with Activist and Truth Teller "Corn Pop"!
92.4K20 -
 1:50:18
The Quartering
3 hours agoWhat The Heck Is Even Happening?
97.4K22 -
 1:16:59
iCkEdMeL
2 hours ago $5.08 earnedICE SHOOTS Popular TikToker ‘Richard’ During Raid in South L.A.?! 😳 What Really Happened LIVE
19.3K15 -
 16:57
16:57
Clownfish TV
11 hours agoLord of the Rings is RACIST Again According to UK College Course... | Clownfish TV
4.62K13 -
![[Ep 774] Trump’s Ballroom Blitz | 9th Circuit OK’s Guard in Portland | Guest: Sam Anthony](https://1a-1791.com/video/fww1/00/s8/1/2/Z/E/s/2ZEsz.0kob-small-Ep-774-Trumps-Ballroom-Blit.jpg) LIVE
LIVE
The Nunn Report - w/ Dan Nunn
2 hours ago[Ep 774] Trump’s Ballroom Blitz | 9th Circuit OK’s Guard in Portland | Guest: Sam Anthony
171 watching -
 1:05:27
DeVory Darkins
5 hours ago $35.54 earnedTrump scores HISTORIC IMMIGRATION WIN as Democrats STUNNED by ballroom renovations
118K60 -
 43:40
43:40
The Rubin Report
4 hours agoDark Future Predictions & Exposing the Truth About Australia’s Past | Tony Abbott
36.2K15 -
 1:57:45
The Charlie Kirk Show
5 hours agoThis is What Democracy Looks Like + Oxford Union Election Fraud? | Dr. Orr, Ogoloma, Harmon | 10.21
97.6K31 -
 26:07
26:07
Lady Decade
12 hours agoGaming Feminists Just Discovered Islam - & It’s Not Going Well
36.8K13 -
 3:52
3:52
Michael Heaver
4 hours agoErupting UK Voters Send FEROCIOUS Message
16.5K8