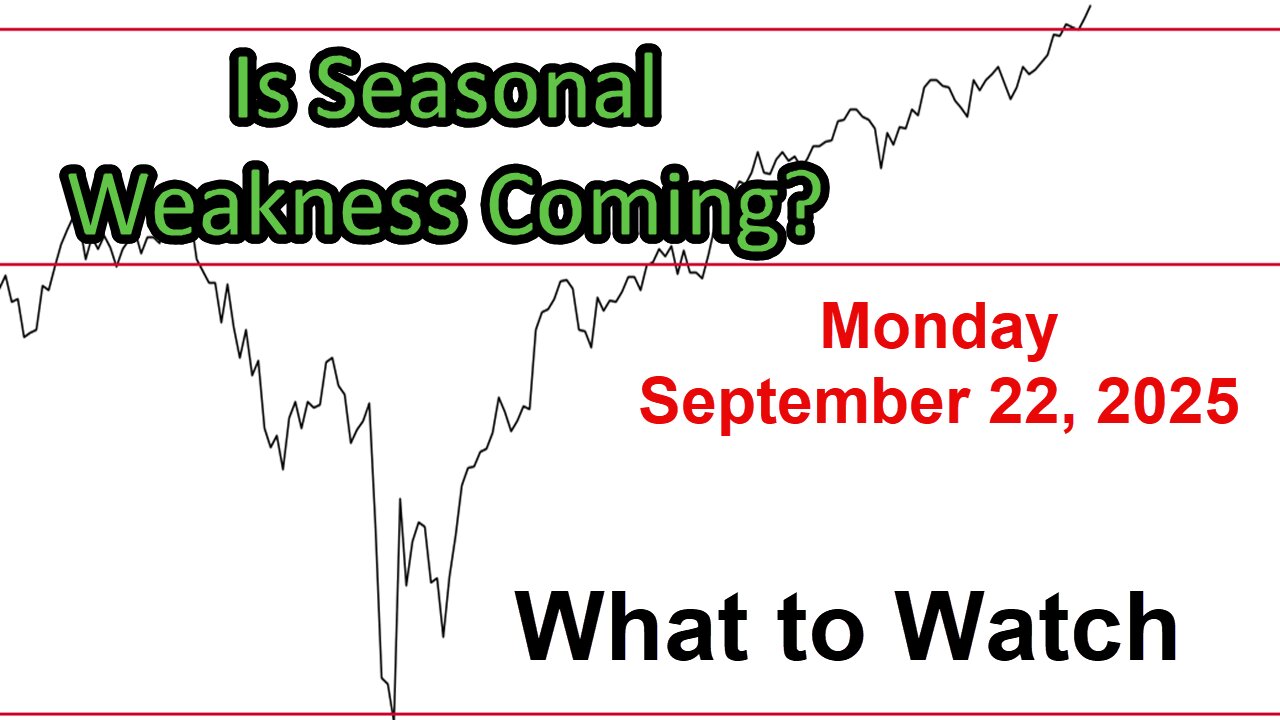
What to Watch Update for Monday September 22, 2025
Link to The SPX Investing Program https://spxinvesting.substack.com
Link to The Daily Pivot Newsletter: https://thedailypivotnewsletter.substack.com/
Link to Video-Only Immediate Access:
https://spxvideos.substack.com/
Summary of the "What to Watch" Video Update:
This video, prepared over the weekend, analyzes market charts to identify current trends, categorized into positive, negative, and watchlist items, with a focus on potential seasonal weakness in September.
Key Points:
1. Seasonal Weakness Concerns:
Historically, August in post-election years is negative (since 1950), but 2025 saw a positive August.
September is typically the worst-performing month for stocks, yet the market is hitting all-time highs.
The week after options expiration (last Friday) tends to be negative, but no significant weakness has emerged.
The second half of September is historically the worst-performing period, raising questions about potential declines.
2. Positive Indicators:
The S&P 500 set all-time highs, driven by a Fed rate cut announcement on Wednesday, leading to market volatility but an overall positive week.
Sentiment is improving but not overly exuberant, suggesting room for further gains without hitting overbought levels (e.g., sentiment below 75).
Growth vs. value ratios are positive, especially for large caps and mid-caps, with large cap growth ETFs leading the charge (e.g., Apple, Google).
Smart money indicators (accumulation distribution, Boom, Chaikin Money Flow & Oscillator) are positive, with buying activity noted on options expiration day.
Stock-to-bond ratios (e.g., S&P 500 vs. 3-7 year bonds) suggest optimism about a soft landing, with no immediate recession fears.
Discretionary vs. staples and tech vs. utilities ratios are strong, indicating market strength in growth sectors.
Momentum indicators, bullish percent indexes, and trend indicators (short- and intermediate-term) remain positive.
3. Negative Indicators:
Negative divergences in the McClellan Oscillator (S&P and NYSE) show weaker internal strength despite all-time highs.
Advance-decline lines are flat or slightly negative, with volume outperforming price, which could be a positive clue but raises concerns.
Small cap growth-to-value ratio is declining, and home construction weakened post-Fed rate cut due to rising interest rates.
The S&P is over 10% above its 200-day moving average, a level that historically preceded declines (e.g., 2023, 2024).
Employment data is mixed but taken as positive, with unemployment at 4.3% and continuing claims range-bound.
4. Watchlist Items:
Seasonality: Monitor for negative seasonality in late September, per Stock Traders Almanac data.
Employment: Recent drop in weekly claims is positive, but continuing claims need to decline further.
Investor Sentiment: AAII survey shows bearish sentiment, which could fuel further upside if investors capitulate to the upside.
10-Year Yield: Rising since the Fed cut, potentially pressuring stocks if it continues.
Inflation/Interest Rates: Bond ratios (e.g., TIPS vs. 3-7 year bonds) suggest low concern, but monitor for changes.
Small Caps vs. Large Caps: Large caps are outperforming short-term, but possibly a shift to small cap outperformance.
Oil and Retail: Oil prices are in the low 60s (geopolitical watch), and retail sales are solid but need to sustain momentum.
Global Markets: U.S. stocks outperforming German DAX and global markets, but emerging markets are strong.
Dollar: In a downtrend, but a bounce could pressure stocks.
Conclusion:
The S&P 500 is positive, with the S&P 500 and NASDAQ 100 setting all-time highs, supported by Fed rate cuts and strong growth sectors. However, negative divergences and historical seasonal patterns warrant caution. Key levels to watch include S&P 500 pivot points (now support at R1) and NASDAQ 100 resistance at R2. No immediate downturn is confirmed, but late September seasonality and rising yields are critical to monitor.
PDF of Slides: https://drive.google.com/file/d/1dY5XY3J0NSdXwd4VsQJB6hjYQpn0xstx/view?usp=sharing
DISCLAIMER This video is for entertainment purposes only. I am not a financial adviser, and you should do your own research and go through your own thought process before investing in a position. Trading is risky!
-
 41:36
41:36
The SPX Investing Program
6 hours agoS&P 500 Daily Update for Thursday October 16, 2025
7 -
 LIVE
LIVE
TimcastIRL
2 hours agoTrump Admin CATCHES Illegal Immigrant POLICE OFFICER, Democrats ARM Illegal In Chicago | Timcast IRL
7,625 watching -
 LIVE
LIVE
SpartakusLIVE
2 hours agoNEW Mode - ZOMBIES || LAST Stream from CREATOR HOUSE
859 watching -
 3:36:25
The Charlie Kirk Show
4 hours agoTHOUGHTCRIME Ep. 101 The New York City Communist Debate? MAGA vs Mamdani? Medal of Freedom Reactions
117K34 -
 LIVE
LIVE
Alex Zedra
1 hour agoLIVE! Battlefield 6
117 watching -
 LIVE
LIVE
Flyover Conservatives
21 hours agoSatan’s Agenda vs. God’s Timeline: Witchcraft, Israel, and the Assassination of Charlie Kirk w/ Robin D. Bullock and Amanda Grace | FOC Show
2,205 watching -
 LIVE
LIVE
PandaSub2000
5 days agoLIVE 10pm ET | BYE SWEET CAROLE (The Disney'ish Horror Game)
90 watching -
 1:22:51
Glenn Greenwald
6 hours agoThe Irony of John Bolton's Classified Docs Indictment; Prominent Dems Now Stutter When Asked About AIPAC; Celebs in Saudi Arabia Controversy: What Does it Reveal? | SYSTEM UPDATE #532
52.6K31 -
 39:25
39:25
Donald Trump Jr.
5 hours agoFBI's Incredible Crime Crackdown, Plus my Message to ABC!! | TRIGGERED Ep.283
123K101 -
 LIVE
LIVE
BigTallRedneck
3 hours agoPGA 2K25 - REDNECK'S WAY OR THE HIGHWAY
47 watching