Premium Only Content

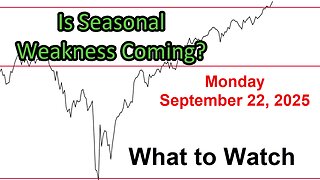
Deep Dive Update for Monday September 22, 2025
Link to The SPX Investing Program https://spxinvesting.substack.com
Link to The Daily Pivot Newsletter: https://thedailypivotnewsletter.substack.com/
Link to Video-Only Immediate Access:
https://spxvideos.substack.com/
Summary of the Deep Dive Video Update for Monday, September 22, 2025
The weekly deep dive video analyzes stock market charts not covered in daily videos, focusing on longer-term insights and informational indicators rather than direct decision-making tools. Key points include:
1. VIX (Volatility Index):
The Long-Term VIX 50-period exponential moving average is below 20 level and declining, indicating a positive market environment. Historically, lower VIX ranges align with bullish markets (e.g., post-2022 bear market recovery).
Despite all-time highs in the S&P and NASDAQ 100, internal weaknesses suggest a potential pullback in late September, a seasonally weak period. However, any decline is likely to be a normal correction (3-10%) rather than a major downturn.
Momentum indicators of the VIX such as the MACD and RSI are flat or neutral, offering little insight. The VIX-to-VVIX (volatility of volatility) ratio is declining, which is positive.
2. Other Sentiment Indicators:
The Ulcer Index is below its moving average, indicating low market fear.
The MOVE Index (bond volatility) shows a slight uptick but no major concern, yet.
The SKEW Index (out-of-the-money options) recently dropped from a high reading, suggesting no imminent large market move.
3. Market Ratios and Performance:
Large caps are outperforming small caps long-term, but small caps are gaining in a lower interest rate environment due to anticipated rate cuts in October and December.
Momentum stocks outperformed during the March-April 2025 downturn but are now range-bound relative to the S&P.
U.S. stocks are slightly outperforming global stocks, with emerging markets doing well compared to developed markets.
4. Advance-Decline Lines:
The S&P cumulative advance-decline line (volume-based) hit an all-time high, suggesting positive momentum despite price-based lines not confirming.
NYSE advance-decline lines are volatile but holding up, showing no significant weakness.
5. Technical Analysis:
The S&P is in a short & Intermediate-term uptrend, above 20- and 50-period moving averages, but extended from the 20-period average, hinting at a possible pullback to test support.
Intermediate and long-term trends remain positive, with multiple support levels (e.g., 50- and 100-period moving averages) if a decline occurs.
Bollinger Bands and Connor’s RSI show no extreme readings, indicating a stable uptrend.
6. Sector and Index Insights:
NASDAQ Composite (89.7) and NASDAQ 100 (86.7) lead technical scores, followed by Russell 2000 (81.2). The S&P 500 (75.2) and Dow (54.8) lag, with mid-caps weakest (49.9).
Growth (e.g., biotech, tech) is outperforming value (e.g., utilities, healthcare). Retail and discretionary sectors are solid but not outperforming the S&P.
Regional banks show improvement with a golden cross in their ratio to financials, but they remain range-bound.
7. Other Observations:
The S&P 500 is up 90.71% since October 2022, 62.4% since October 2023, and 37.87% since April 2025, reflecting a strong rally.
Negative divergences include the NYSE advance-decline line and Dow vs. transports.
Inflation and interest rate concerns are low, with cash-to-bond and TIPS-to-bond ratios range-bound or declining.
The German DAX is underperforming U.S. indices, and U.S.-German yield spreads correlate with the U.S. dollar index.
Takeaway: The S&P 500 remains broadly positive with strong technicals, but internal weaknesses and seasonal factors suggest a potential short-term pullback is possible. Support levels (20- and 50-period moving averages) will be key if a correction occurs. Most indicators point to a healthy market environment.
PDF of Slides: https://drive.google.com/file/d/1a0wMbolBsdaLuuxRLYvMxvZutlIXSks7/view?usp=sharing
DISCLAIMER This video is for entertainment purposes only. I am not a financial adviser, and you should do your own research and go through your own thought process before investing in a position. Trading is risky!
-
 37:25
37:25
The SPX Investing Program
2 days agoWhat to Watch Update for Monday September 22, 2025
11 -
 2:04:25
Steven Crowder
5 hours agoBreaking: ICE Facility Shot in Dallas - Another Left-Wing Attack?
454K378 -

Mark Kaye
3 hours ago🔴 Jimmy Kimmel ROASTED For Fake Tears During Late Night Return
28.3K7 -
 1:07:28
Rebel News
2 hours agoLIVE | Fire at ostrich farm, RCMP & CFIA siege property, Rebels on the ground | Buffalo Roundtable
24.4K5 -
 1:02:08
The Rubin Report
4 hours agoCharlie Kirk’s Murder Has Officially Backfired
65.4K40 -
 1:04:04
The Drew Allen Show on DailyClout
2 hours ago"What the Kimmel Saga Has Taught Us About the Left"
17K2 -
 LIVE
LIVE
LFA TV
15 hours agoBREAKING NEWS: SHOOTER IN DALLAS! | WEDNESDAY 9/24/25
2,676 watching -
 1:00:09
VINCE
6 hours agoThe Globalists SABOTAGE Trump At The U.N.? | Episode 132 - 09/24/25
251K289 -
 DVR
DVR
Bannons War Room
7 months agoWarRoom Live
37.8M8.8K -
 58:18
58:18
Grant Stinchfield
2 hours ago $0.75 earnedMedia Malpractice: Media Ignores Race Unless the Suspect is "White"
15.3K4