Premium Only Content

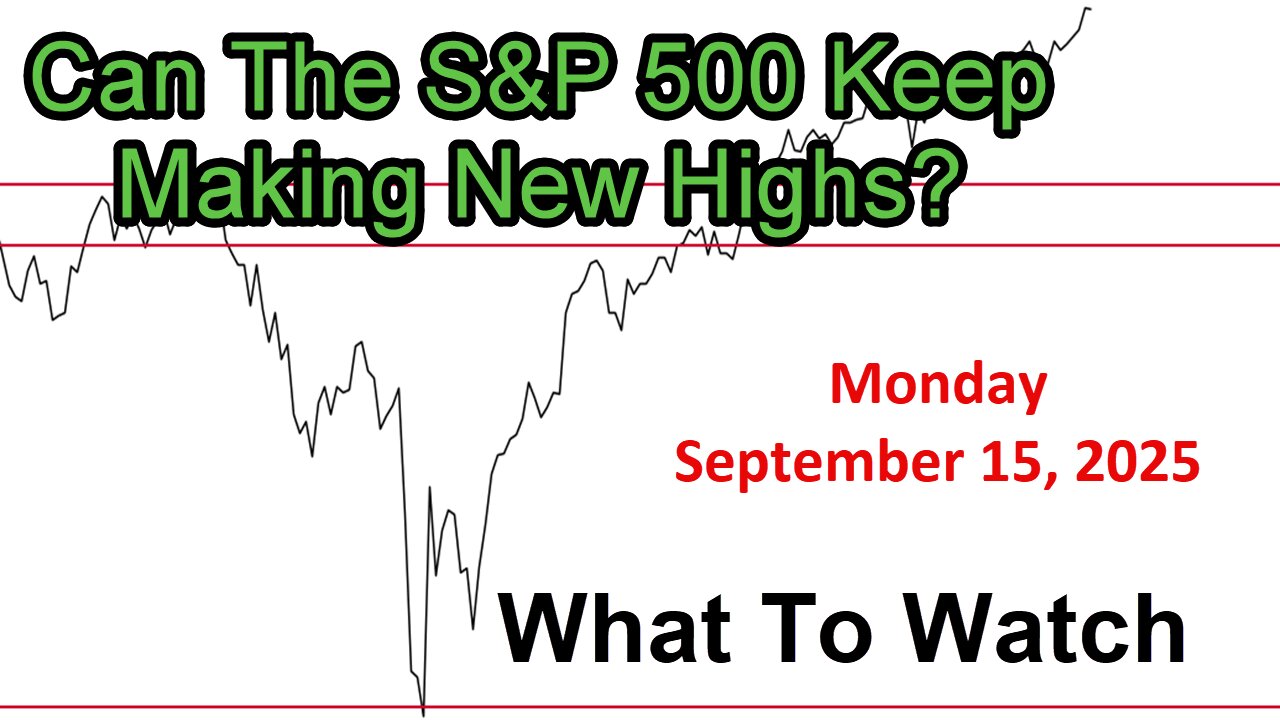
What to Watch Update for Monday September 15, 2025
Link to The SPX Investing Program https://spxinvesting.substack.com
Link to The Daily Pivot Newsletter: https://thedailypivotnewsletter.substack.com/
Link to Video-Only Immediate Access:
https://spxvideos.substack.com/
Summary of the "What to Watch" Video Update:
This video, the last of the weekend updates, categorizes market charts into positive, negative, and watchlist groups as of mid-September 2025. The market appears strong, with more positive than negative signals, despite a potentially weak seasonal period. The Federal Reserve is expected to cut rates by 25 basis points this week, with another cut anticipated in October, which the market is factoring in. However, there’s caution about post-rate-cut reactions, as markets may experience volatility or profit-taking after the announcement and the Fed’s press conference.
Positive Indicators:
Market Performance: The S&P 500 is near all-time highs, with NASDAQ and NASDAQ 100 setting new highs. The market shows short-term conviction, with strong sessions on Thursday and a stable Friday.
Technical Indicators: Most charts are positive, with the S&P above key pivot points and moving averages. The VIX is below 20, indicating lower market fear. Growth outperforming value, especially in large caps, with the discretionary sector strong.
Trends and Momentum: Short- and intermediate-term trends are strengthening (ADX above 20, green line above red). The bullish percent index, parabolic SAR, and cumulative advance-decline lines are positive. Volume often leads price, a bullish signal.
Sector Strength: Large-cap growth, semiconductors, and the FANG index hit all-time highs. Ratios such as the S&P to utilities, staples to tech, and stocks to bonds suggest a soft landing and market optimism.
Negative Indicators:
Sentiment and Smart Money: The Fear and Greed Index is trending down, indicating skepticism, which could be bullish if it drives FOMO. However, two of three smart money indicators (Chaiken Money Flow & Oscillator, S&P McClellan Oscillator) are negative, showing bearish sentiment and lower highs despite market gains.
Divergences: Negative divergences in momentum oscillators and stocks above 50-day moving averages suggest waning enthusiasm. Small and mid-cap growth-to-value ratios are weak, indicating defensiveness.
Overbought Concerns: The S&P is 10% above its 200-day moving average, a level historically followed by corrections. Closing above the upper Bollinger Band suggests an overbought condition that may not persist.
Watchlist:
Economic Indicators: Initial jobless claims spiked, seen as positive for rate-cut hopes, but continued rises could signal economic weakness. The 10-year yield is near 4%, and a rise could pressure stocks. Inflation expectations are mixed, with short-term calm but intermediate-term concerns increasing.
Sectors and Ratios: Retail, home construction, and discretionary-to-staples ratios are improving but need monitoring. Semiconductors and home builders are strong, but transports and regional banks are range-bound. The German DAX is underperforming the S&P, boosting U.S. stock leadership.
Global and Commodity Trends: Gold, oil, and the dollar are in focus. Gold is rising relative to the S&P, oil is in a downtrend, and a weaker dollar is supporting stocks. U.S. vs. international stocks are neutral, with emerging markets showing slight breakout potential.
Key Question: Can the S&P 500 sustain new highs post-Fed rate cut, or will profit-taking and overbought conditions trigger a pullback? The market’s reaction to the Fed’s commentary will be critical.
PDF of Slides:
https://drive.google.com/file/d/1ykWprIZiWowqY2HbpGN7tmC2tchPihRV/view?usp=sharing
DISCLAIMER This video is for entertainment purposes only. I am not a financial adviser, and you should do your own research and go through your own thought process before investing in a position. Trading is risky!
-
 4:35
4:35
The SPX Investing Program
10 hours agoDaily Update Podcast for Friday September 26, 2025
17 -
 LIVE
LIVE
Dr Disrespect
3 hours ago🔴LIVE - DR DISRESPECT - ARENA BREAKOUT: INFINITE - STORM EVENT
11,550 watching -
 LIVE
LIVE
Barry Cunningham
3 hours agoPRESIDENT TRUMP SPEAKS ON JAMES COMEY INDICTMENT! MORE TO COME! DELICIOUS LIBERAL MELTDOWNS!
1,646 watching -
 1:33:51
Steve-O's Wild Ride! Podcast
1 day agoJohn C. Reilly's Surprising Connection To Jackass (And Beef With Weeman!)
7193 -
 LIVE
LIVE
StoneMountain64
1 hour agoBattlefield 6 News and Extraction Gaming
101 watching -
 2:13:30
Side Scrollers Podcast
4 hours agoUK Introduces MANDATORY Digital ID + Dallas ICE Shooting BLAMED on Gaming + More | Side Scrollers
50.9K3 -
 1:54:17
The Charlie Kirk Show
3 hours agoCharlie's Last Trip + What's Next + AMA | Erika Kirk, Mikey McCoy | 9.26.2025
200K150 -
 1:02:53
The Quartering
2 hours agoMAGA Kid Kidnapped, Hasan Piker Meltdown, Vivek Fights For Alex Jones & More
89.8K24 -
 32:49
32:49
Simply Bitcoin
1 day ago $0.88 earnedBitcoin Crucible w/ Alex Stanczyk | EP 1
8.13K -
 1:57:37
Tucker Carlson
1 hour agoCharlie Sheen’s Craziest Hollywood Stories and Why He Refuses to Believe the Official Story of 9/11
24.6K28