Creating a Perfect Rainbow Circle with Python and Matplotlib
Creating a Perfect Rainbow Circle with Python and Matplotlib
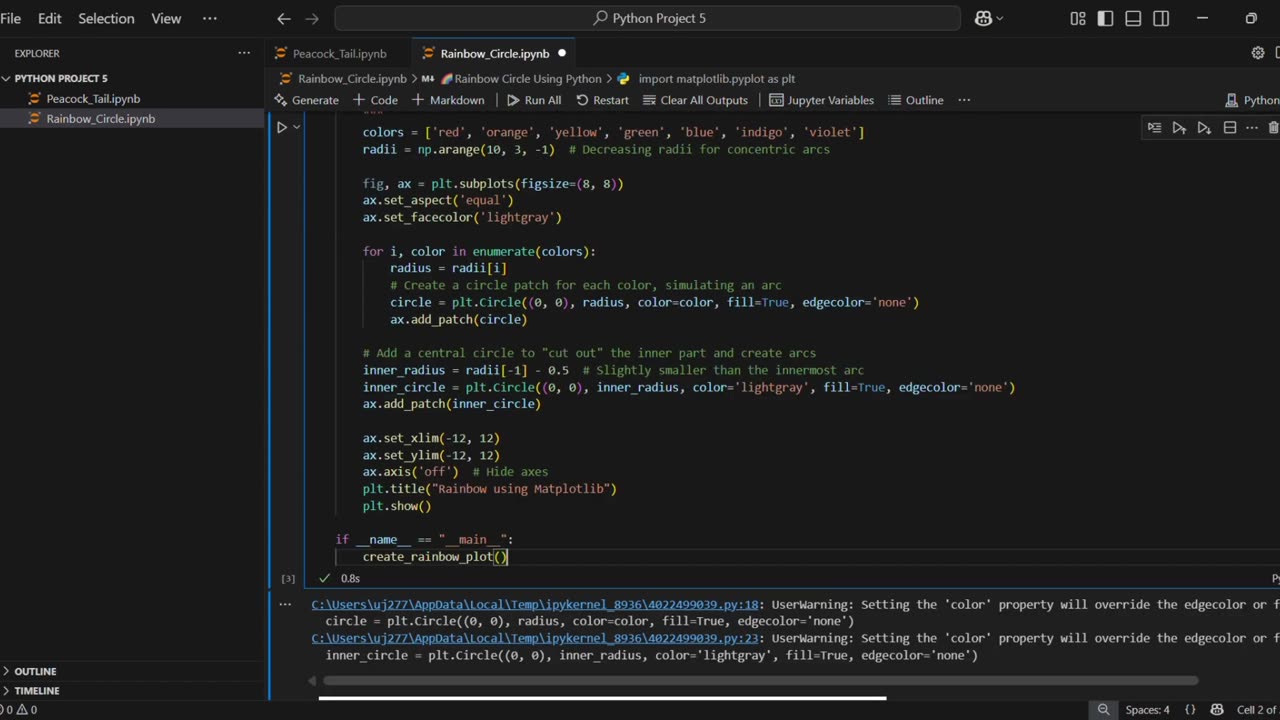
In this Python tutorial, we create a vibrant and visually perfect rainbow circle using Matplotlib. This project is a fantastic introduction to creative coding and data visualization, demonstrating how to use basic geometric shapes and color theory to generate beautiful graphics programmatically.
You'll learn how to use Matplotlib's Circle patches, arrange them concentrically, and apply the classic colors of the rainbow (ROYGBIV) to build this iconic symbol. This is a great exercise for beginners to understand object-oriented plotting in Python.
What you'll learn:
How to create and customize figures and axes in Matplotlib
Using plt.Circle to draw circular patches
Adding geometric shapes to a plot with add_patch()
Working with color sequences and arrays
Customizing plot aesthetics and turning off axes for a clean visual
Subscribe for more Python tutorials, creative coding projects, and data visualization content!
#Python #Matplotlib #DataVisualization #PythonProject #PythonTutorial
-
 0:39
0:39
AI Evolutionary Technology
7 days agoHow to Create a Streamgraph in Python
1 -
 LIVE
LIVE
Sarah Westall
1 hour agoWar Exploding Around the World: Nepal, Israel, Qatar, Venezuela, Thailand, more... w/ Michael Yon
338 watching -
 LIVE
LIVE
SpartakusLIVE
3 hours agoThe Most INSANE Snipes EVER || Solo to Duos w/ StevieT - PUBG or Mordor Later?!
336 watching -
 UPCOMING
Flyover Conservatives
11 hours agoThe Truth About Israel & End Times Nobody Wants to Say - Phil Hotsenpiller | FOC Show
3.04K -
 1:53:04
Glenn Greenwald
4 hours agoIsrael Bombs Qatar and Trump Reacts; The Hoax to Blame Russia for Jamming EU President's Plane GPS; Mamdani Soars in Polls as he Tries to Moderate on Israel | SYSTEM UPDATE #511
64.2K36 -
 2:47:57
Barry Cunningham
3 hours agoLIVE: PRESIDENT TRUMP ANNOUNCEMENT | IRYNA ZARUTSKA DESERVES IMMEDIATE JUSTICE! NO WAITING!
28.2K22 -
 UPCOMING
Anthony Rogers
1 day agoEpisode 382 - Crystal Balls & Comedy Calls
121 -
 LIVE
LIVE
LFA TV
14 hours agoLFA TV ALL DAY STREAM - TUESDAY 9/9/25
895 watching -
 3:23:21
MattMorseTV
5 hours ago $9.08 earned🔴Conflict in EASTERN EUROPE.🔴
49.5K26 -
 50:17
50:17
Sean Unpaved
3 hours agoVikings vs. Bears MNF Thriller: J.J. McCarthy's Clutch Comeback & NFL Week 1 Recap
11.9K2