How to Create a Streamgraph in Python
How to Create a Streamgraph in Python | Easy Data Visualization Tutorial
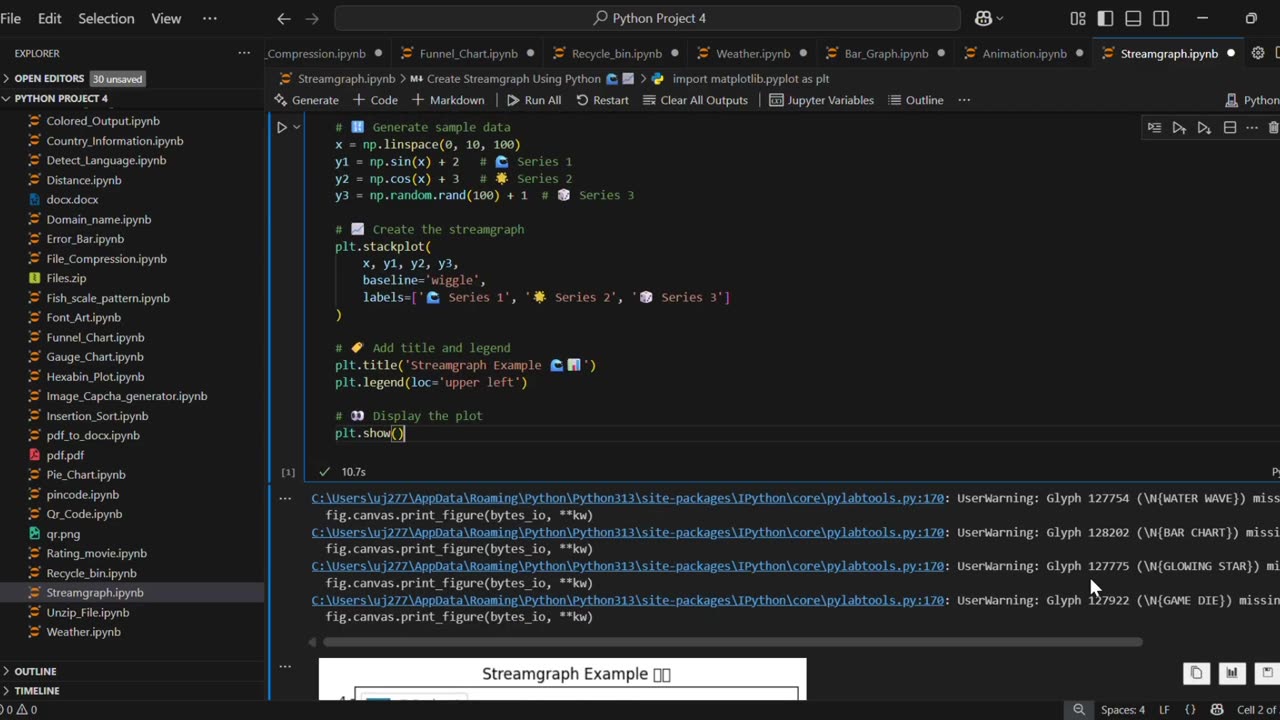
In this video, you’ll learn how to create a Streamgraph using Python and Matplotlib. A streamgraph is a type of stacked area chart with a smooth, flowing baseline, making it visually appealing for data visualization.
✅ What you’ll learn:
How to generate sample data in Python
How to plot a Streamgraph using matplotlib.stackplot()
Customize titles, labels, and legends for better visuals
This tutorial is beginner-friendly and perfect for anyone learning Python data visualization. 🚀
#Python #Matplotlib #DataVisualization #PythonProjects #Streamgraph #PythonForBeginners #PythonTutorial #LearnPython #PythonMatplotlib #PythonCharts
🔔 Subscribe for more Python, Data Science, and Data Visualization tutorials!
-
 0:36
0:36
AI Evolutionary Technology
10 days agoCreate Empty Recycle Bin with Python
11 -
 LIVE
LIVE
Benny Johnson
1 hour agoAmerican Martyr: Remembering Charlie Kirk | FBI Reveals New Footage of Assassin, Trump's Eulogy LIVE
9,357 watching -
 LIVE
LIVE
VINCE
2 hours agoRest In Peace Charlie Kirk | Episode 123 - 09/11/25
66,919 watching -
 LIVE
LIVE
LFA TV
5 hours agoLFA TV ALL DAY STREAM - THURSDAY 9/11/25
5,246 watching -
 LIVE
LIVE
Bannons War Room
6 months agoWarRoom Live
17,206 watching -
 UPCOMING
The Shannon Joy Show
10 minutes agoA message of encouragement and a call for faith and unity after the tragic killing of Charlie Kirk
-
 UPCOMING
The Big Mig™
57 minutes agoIn Honor Of Charlie Kirk, Rest In Peace 🙏🏻
275 -
 1:36:35
The White House
2 hours agoPresident Trump and the First Lady Attend a September 11th Observance Event
52.9K14 -

Dear America
2 hours agoWe Are ALL Charlie Now! This Isn’t The End. We Will FIGHT FIGHT FIGHT
140K159 -
 LIVE
LIVE
Badlands Media
9 hours agoBadlands Daily: September 11, 2025
4,749 watching